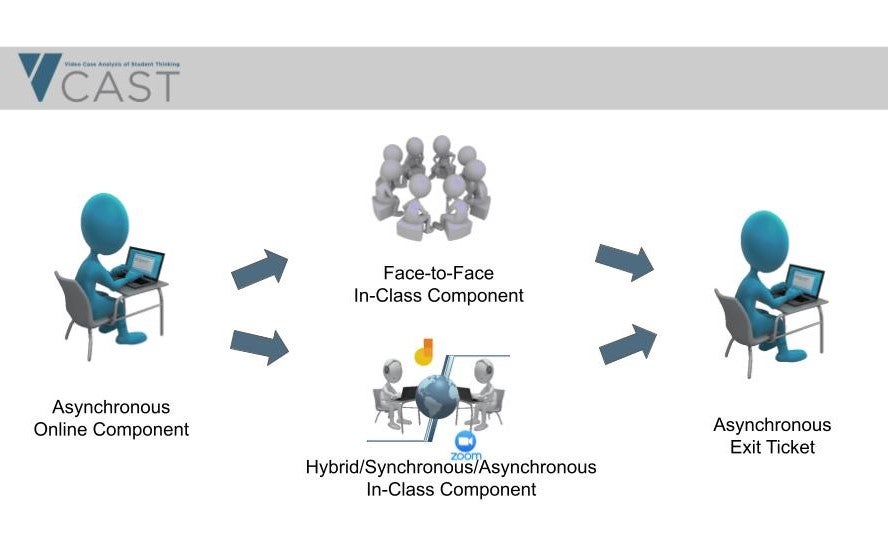
Since 2017, we have been developing a series of online video-based modules to engage secondary mathematics teacher candidates in analyzing secondary students’ reasoning. Each module features a mathematical task, a sequence of carefully-selected video clips of students articulating their ideas, and images of student work. The following is an overview of the mathematical ideas addressed in each module.

The Bus Stop Task Module
The Bus Stop Task, adapted from Swan (1985), is an example of a discrete, two-variable, graphical reasoning task that requires students to coordinate two quantities with a single point, while simultaneously assigning what is perceived as a “vertical” quantity (height in this case) to a horizontal axis. In this module, candidates observe conceptual challenges such as interpreting the point labels, attending to both quantities, maintaining axes assignments for height and age, and drawing contextually-based conclusions about points.
The Hexagon Task Module
The Hexagon Task, adapted from Hendrickson, Honey, Juehl, Lemon, & Sutorios (2012) is an example of a task that involves connecting recursive and explicit representations of functions. In this module, candidates encounter a range of student approaches for generalizing relationships associated with the figural pattern in the Hexagon Task.
The Bottle Filling Task Module
In the Bottle Filling Task (adapted from Swan, 1985), students are given 2-dimensional drawings of three bottles and asked to create a graph relating the volume of the water in the bottle to the height of the water (with height mapped onto the horizontal axis) as they imagine each bottle being filled with a liquid. Candidates engage with covariational reasoning, the key mathematical idea of this module, as they view students working on the Bottle Filling Task.
The Aphids Task Module
In the Aphids Task, bivariate data (days, number of aphids) are presented in a table and then in a graph. Students are asked to describe what they notice and what type of equation they might use to model the data. Data that do exhibit a trend are not expected to follow the path of a function model perfectly; rather, a function model is simply one way to capture and perhaps explain the trend in the data. On the other hand, if the data are too scattered and do not follow a trend, there is likely no value in creating a function model. Candidates engage with these ideas as they complete this module, which is structured around ways that students complete the Aphids Task.
References
Hendrickson, S. Honey, J., Juehl, B., Lemon, T., Sutorios, J. (2012). Secondary mathematics I: An integrated approach; Module 3: Arithmetic and geometric sequences. Salt Lake City, UT: Mathematics Vision Project. Retrieved from https://www.mathematicsvisionproject.org
Swan, M. (1985). The language of functions and graphs. Shell Centre & Joint Matriculation Board, Nottingham.
Thompson, P. W., & Carlson, M. P. (2017). Variation, covariation, and functions: Foundational ways of thinking mathematically. In J. Cai (Ed.), Compendium for research in mathematics education (pp. 421-456). Reston, VA: National Council of Teachers of Mathematics.
Funded through the National Science Foundation.
