Survey Details
 Report Author
Jeffrey Lyons, Ph.D.
Survey Research Director, Idaho Policy Institute
About the Survey
The Third Annual Treasure Valley Survey was conducted October 19th-November 4th, 2018 and surveyed 1,037 adults currently living in Ada, Canyon, Boise, Gem, and Owyhee counties. The sample is designed to be representative of the population, with 59% of the respondents living in Ada County, 26% in Canyon County, 6% in Boise County, 6% in Gem County, and 3% in Owyhee County. This survey was conducted with a mixed-mode sampling approach that contacted respondents through several different means in order to increase our coverage amongst populations that may not respond at high rates to traditional phone surveys. Respondents were contacted on land line phones (20% of the sample), through email (12%), via text message with a link to an online survey (65%), and on cell phones (2%). People were asked about their attitudes on growth, transportation, housing, education, taxes, and government funding.
- A sizeable majority (72%) of Treasure Valley residents believe that the pace of growth is too fast, and this number has increased in recent years from 50% in 2016 and 55% in 2017.
- The two issues related to growth that are believed to be the largest problems are traffic/congestion (66% identify as a big problem) and the lack of affordable housing (60% identify as a big problem).
- A large majority (73%) feel that the Treasure Valley could use more public transportation options, and majorities would be willing to support some increase in the sales tax (62% of respondents) or property tax (51% of respondents) to fund transit.
- People are more divided on what local governments should do regarding affordable housing, with sizeable support for both government-led action and for letting the market determine prices.
- Residents are supportive of letting voters decide on local option taxes by a sizeable majority, but remain more divided on whether they would actually vote in favor of imposing a local option tax in their town.
Because the Treasure Valley has become one of the fastest growing regions in the country, it comes as little surprise that residents are changing their views about growth and the challenges that it presents. We find that a large majority of respondents (72%) feel that the Treasure Valley is growing too fast and only 24% feel that the pace of growth is about right. Almost no respondents (2%) felt that the valley was growing too slowly. Older residents were more likely than younger ones to report that the Treasure Valley was growing too fast (80% of those between 75-84 compared to 66% between 18-24), and both Republicans and Independents were more likely than Democrats to hold that belief (79% of Independents and 77% of Republicans compared to 62% of Democrats).
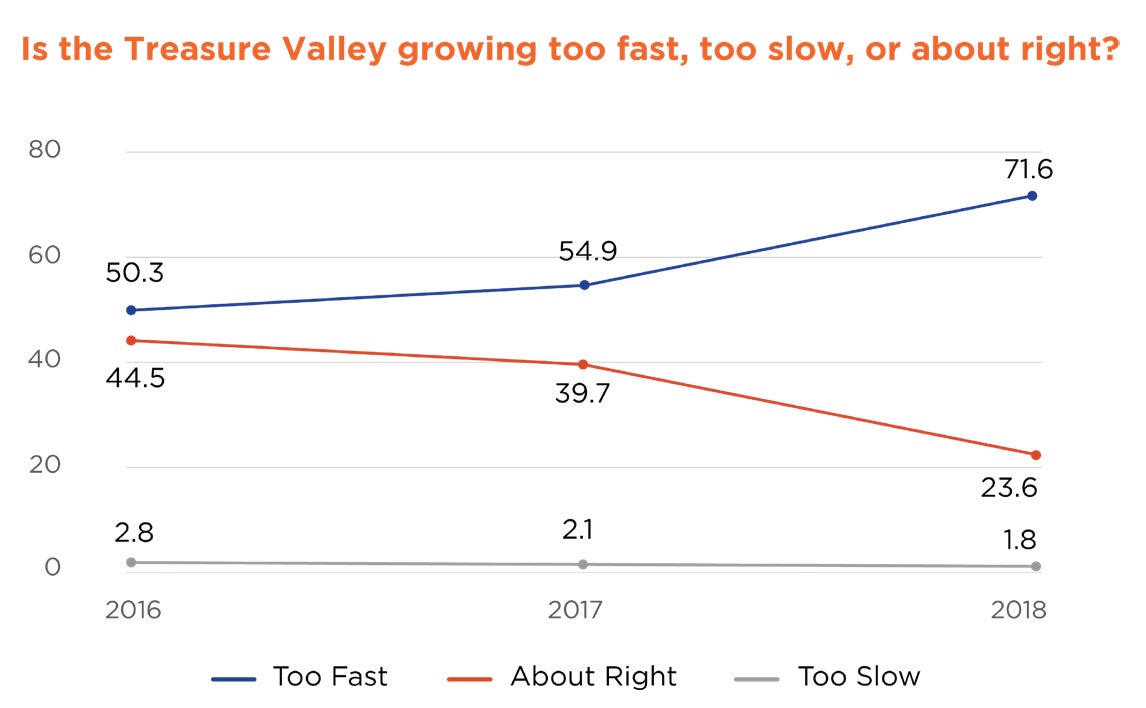
Compared to past years, these numbers represent a significant shift in attitudes. From 2016 to 2018, the perception that growth is occurring too fast has risen 22%, from 50% to the 72% that we find in 2018. Put differently, over the course of two years, residents of the Treasure Valley have gone from being divided about whether the pace of growth was too fast or about right, to adopting the belief that it is too fast by a large margin. The belief that the pace of growth is about right has become the minority position, held by less than 1 in 4 individuals.
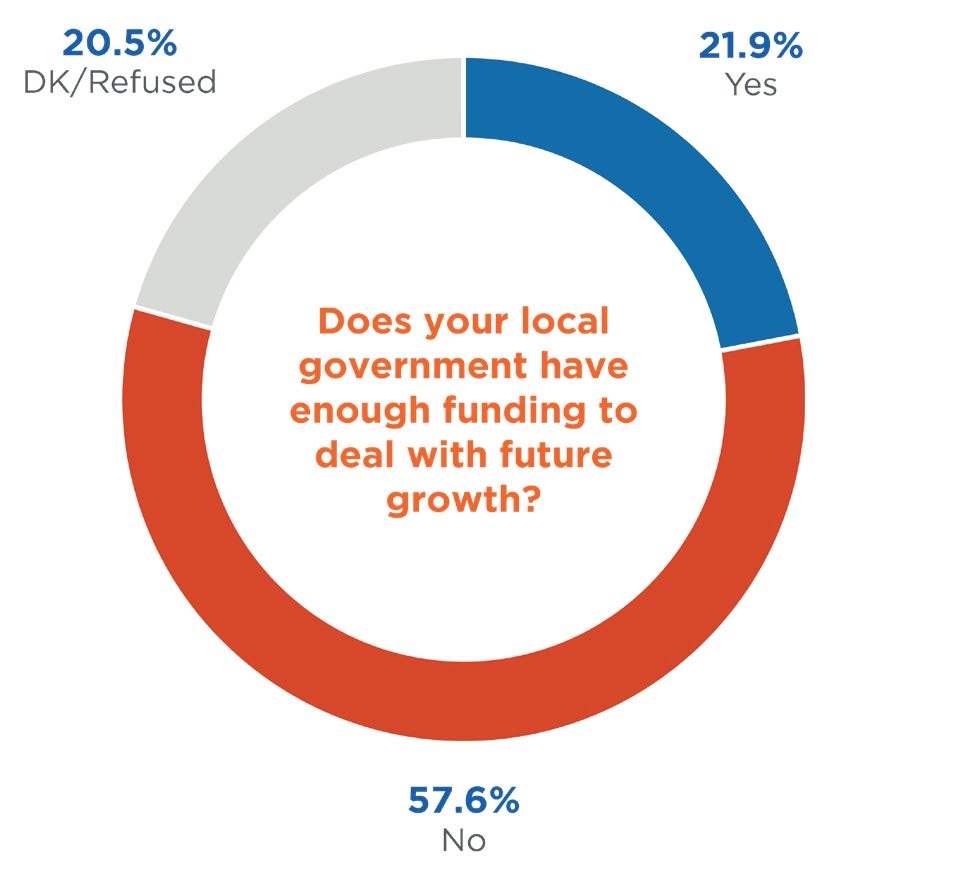
With this in mind, we assessed attitudes about the job that local governments are doing in addressing the issue and their capacity to tackle it in the future. Respondents gave mixed assessments of how well their local government is doing when handling growth issues. The most common response was that local government was doing a fair job (38% of respondents), but there was also a sizeable number with more positive views (24% said good and 4% said excellent), and a large contingent with a negative view of local government performance (31% said poor). Looking to the future, people thought that local governments would need more funding to tackle the challenges presented by growth. When asked if their local government had enough funding to deal with future growth, 58% responded that they did not, and only 22% believed that they did have enough funding. Older respondents were more likely than younger ones to believe that the local government had enough funding (33% of those between 75-84 compared to 19% of those from 18-24), and Republicans were more likely than Democrats to believe that governments have enough funding (28% of Republicans compared to 14% of Democrats).
Looking to the different problems that are associated with growth, we sought to understand which ones people perceived as big problems and which ones were seen as being more minor. When presented with four different issues, traffic congestion and the lack of affordable housing stood out as being the biggest problems. 66% of respondents said that traffic and congestion was a big problem, and 60% identified the lack of affordable housing as a big problem. Residents of Canyon County were more likely than residents of Ada County to identify traffic and congestion as a big problem (72% in Canyon County vs. 63% in Ada County). Younger people were more likely than older to identify the lack of affordable housing as a big problem (72% of those between ages 25-34 stated that it was a big problem compared to 41% from 75-84), and Democrats were more likely than Republicans to hold this belief (72% of Democrats vs. 50% of Republicans). The other options people were presented with – population growth/development and lack of well-paying jobs – were still seen as problems, but with fewer identifying them as big problems.

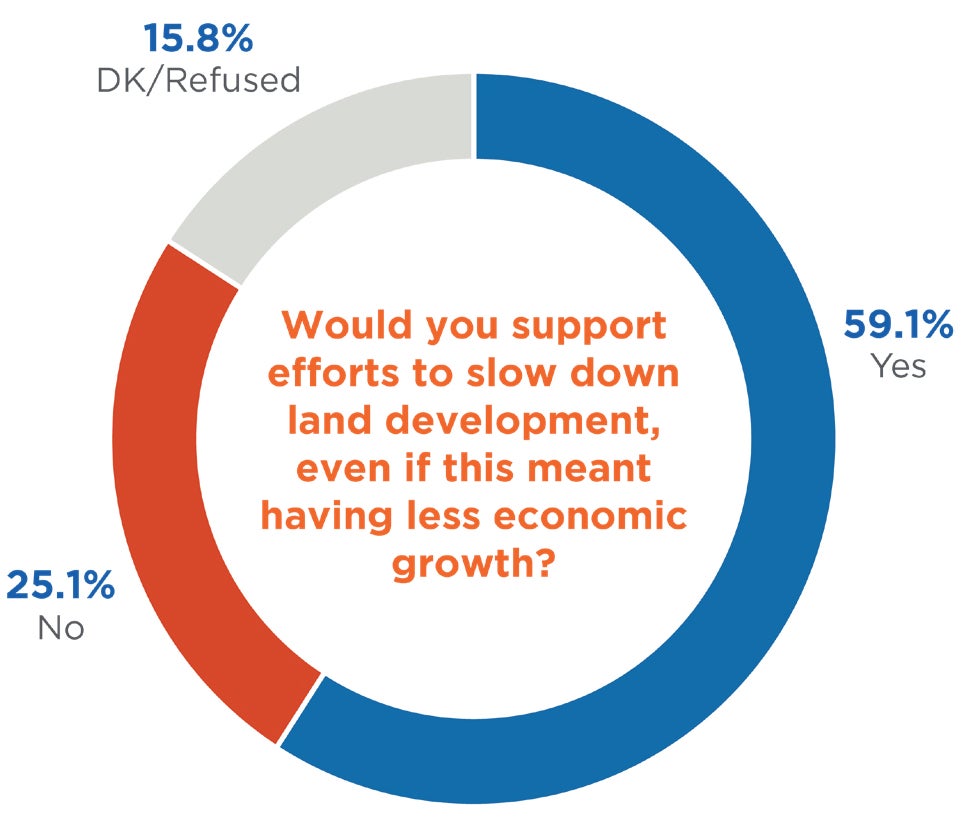
In addition to the challenges presented by growth, we were also interested in how people view growth when considering the positive effects – most notably an expanding economy. It is possible that residents could be frustrated by the issues noted above, but would still prefer to have the growth since they view the economic positives as outweighing the challenges. To explore this possibility, we asked if people would support efforts to slow land development, even if it meant having less economic growth. A majority of people (59%) responded that they would support such efforts even if it meant less economic growth, suggesting that the preference for less land development persists even when presented with less economic growth as a tradeoff. It is important to note that these preferences likely vary when presented with different levels of economic impacts, or if asked in a different economic climate. Nonetheless, the results suggest that citizens are willing to accept some perceived negative consequences in exchange for less development.
With 66% of Treasure Valley residents feeling that traffic and congestion is a big problem, it isn’t surprising that those surveyed expressed a general desire for more public transit options. A large majority (73%) of respondents believe that the Treasure Valley could use more public transportation options, with only 17% believing that there are currently enough. Democrats are more likely to believe that more transportation options are needed than Republicans (89% of Democrats compared to 64% of Republicans).

Since 2016, there has been a modest increase in the share of residents who express that more public transportation options could be used (up from 67% to 73%) and a decrease in the number who believe that there are enough options (from 28% to 17%).
While there appears to be a strong preference for more options, we seek to understand the degree to which people are willing to pay for expanded services. First, we looked to general attitudes about funding transportation. We presented the amount of money that Valley Regional Transit, the public transportation authority for Ada and Canyon Counties, currently spends on annual transit service. 54% of respondents stated that we should spend more, 23% that we are currently spending enough, and 9% that we should spend less. Democrats are more likely to believe that we should invest more in transportation than Republicans (81% of Democrats compared to 49% of Republicans).
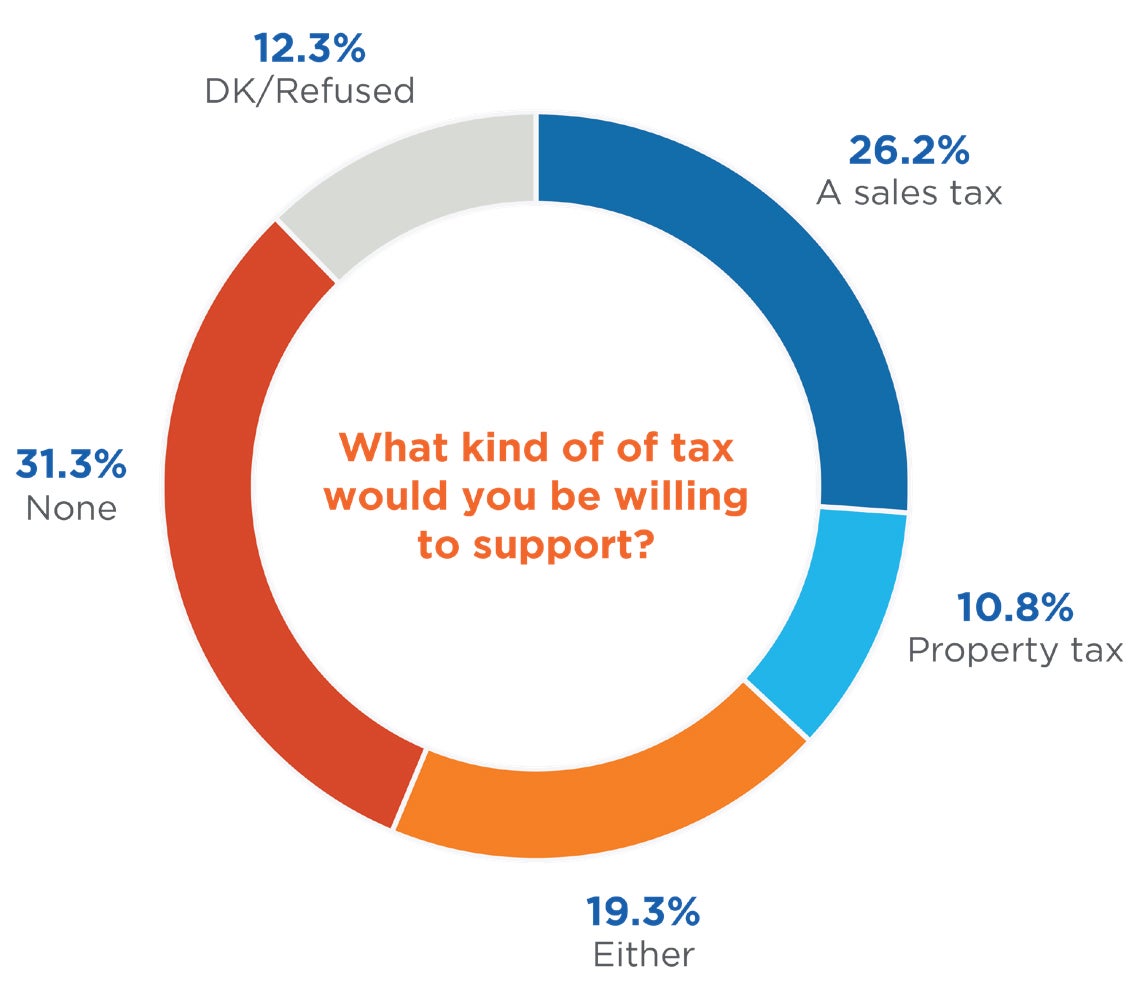
Given this preference for increased funding, how do people prefer to pay for increased transportation? The answer is mixed. When presented with different tax options, most respondents express support for some kind of additional tax, but there is little agreement about what type of tax should be increased. Approximately a quarter of respondents (26%) expressed support for an additional sales tax, a relatively small number (11%) expressed support specifically for a property tax increase, and 19% supported either an additional sales tax or a property tax increase. Consolidating these three categories, a slight majority (56%) favor some type of tax increase. However, almost one in three people indicated a preference for no new taxes (32%). Older respondents were more likely than younger respondents to prefer no new taxes (48% of those between 75-84 compared to 25% between 18-24), and Republicans were more likely than Democrats to prefer no new taxes (39% of Republicans compared to 13% of Democrats).
The previous question tells us about respondents’ preferences among different types of taxes. We also asked how much of a tax increase people would be willing to support. For a sales tax increase, we found that 29% of respondents wanted no increase in the sales tax, a very similar number to what we found previously, and 62% expressed support for some kind of increase. Almost one third of respondents (30%) indicated a willingness to pay one cent per dollar in additional tax, and fewer preferred to pay 1/4 cent per dollar (14%) or 1/2 cent per dollar (18%).

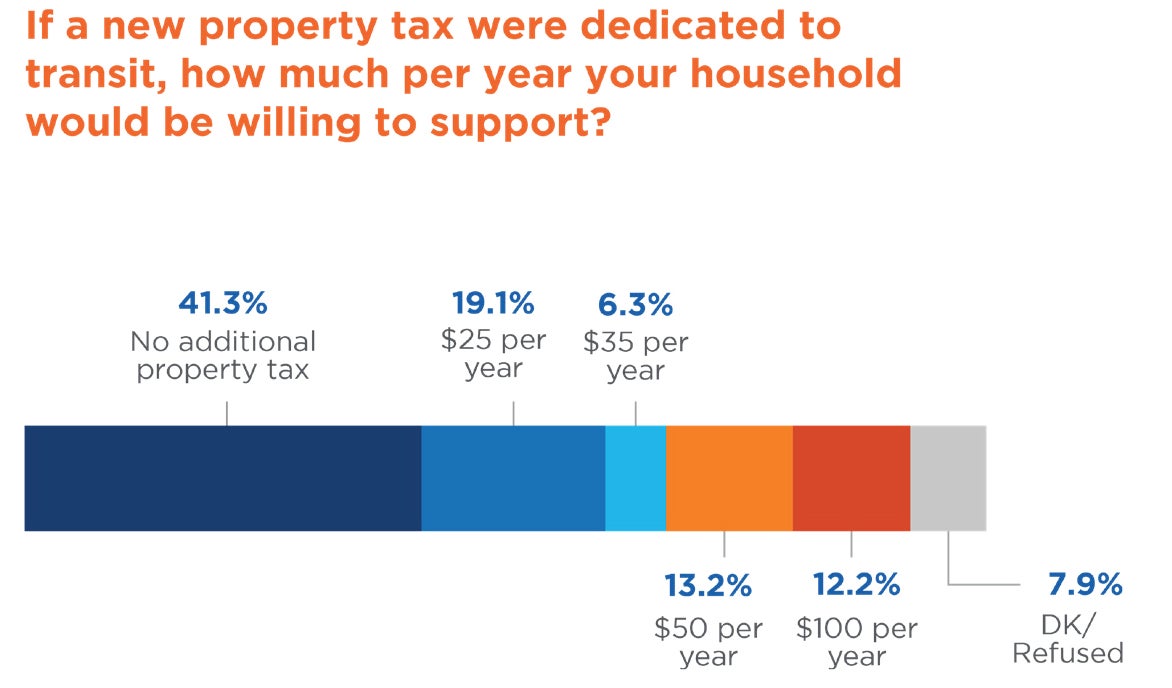
When looking at a willingness to increase property taxes by certain amounts, a larger number (41%) responded that they preferred no property tax. This aligns with the results previously presented that respondents generally preferred sales tax increases to property tax increases. Turning to the 51% of respondents who stated a willingness to increase property taxes, there does not appear to be a strong preference for any one amount of increase. The most common response (19%) was for the lowest amount we proposed – a $25 per year increase.
Another possibility for funding transportation projects is bonding. When asked about support for a specific transportation project – the expansion and widening of state highways 20/26 and 44 – the majority of respondents supported bonding. 67% favored bonding for this project (30% strongly favored), and 26% opposed this.
A lack of affordable housing was identified as a “big problem” by 60% of respondents in the Treasure Valley, highlighting the importance of housing issues. We sought to understand whether people would favor or oppose spending public funds to build affordable housing facilities. One of the challenges with asking these types of questions is that people may say that they are in favor of such government action, but would oppose a specific development that might be located near them.
In order to test this possibility, we conducted a survey experiment which involved splitting our sample of 1,037 respondents into two groups of roughly the same size, and asked a slightly different version of the question to each group. If we see differences in the responses between the groups, it suggests that the different information presented in the two questions caused the responses to change. We presented one group with a version of the question that stated “Some local governments have made efforts to address the lack of affordable housing in the Treasure Valley. Would you say you favor or oppose spending government money to build affordable housing facilities?” The other group was asked the exact same question, but we added in three extra words at the end of the second sentence so it read “Would you say you favor or oppose spending government money to build affordable housing facilities in your neighborhood ?”
In the basic version of the question, we found that a majority of people (55%) favored spending government money to build affordable housing facilities, and 41% opposed this. The usual divides appeared: older residents were less supportive than younger (17% of those from 75-84 strongly favor compared to 49% of those from 18-24), Democrats more supportive than Republicans (47% of Democrats strongly favor compared to 11% of Republicans), and women more supportive than men (33% of women strongly support compared to 19% of men).
In the version where people were asked about building affordable housing in their neighborhood, we saw a decrease to 50% support for spending government money to build affordable housing. This is not an especially large effect so we are cautious in drawing firm conclusions about the differences between the two questions. What we can say is that narrow majorities appear to favor the idea of local governments spending money to build affordable housing.

However, when presented with a slightly different question on this matter, we come to different conclusions. When offered two options – encouraging local governments to take action to increase housing affordability, or letting the market determine housing prices – we find that more people opted for letting the market decide. Almost half of the respondents (49%) selected that option, with a minority (42%) preferring that local governments take action. We see a large partisan difference on this question with Democrats favoring the government taking action more than Republicans (64% of Democrats compared to 26% of Republicans). We also presented this question as another survey experiment. The change in question wording we offered was to add “using tax dollars” to the language about government action so that the question read “Do you believe that local governments should take action to make housing in the Treasure Valley more affordable using tax dollars, or should they let the market determine prices?” When presented with the “using tax dollars” frame, support for local government action fell from 42% to 37%. While not an especially significant difference, it does suggest that the role of tax dollars in the government action may reduce support.
Because we have somewhat conflicting results regarding the role of government in the affordable housing domain, what conclusions can we draw? It is safe to say that attitudes about government intervention on the affordable housing issue are divided, and depend on the considerations that citizens are asked to think about. If asked about government intervention alone, slim majorities express support. However, if asked to think about a government solution vs. allowing market mechanisms set prices, support for government action falls and allowing the market to decide becomes the preference of more citizens.

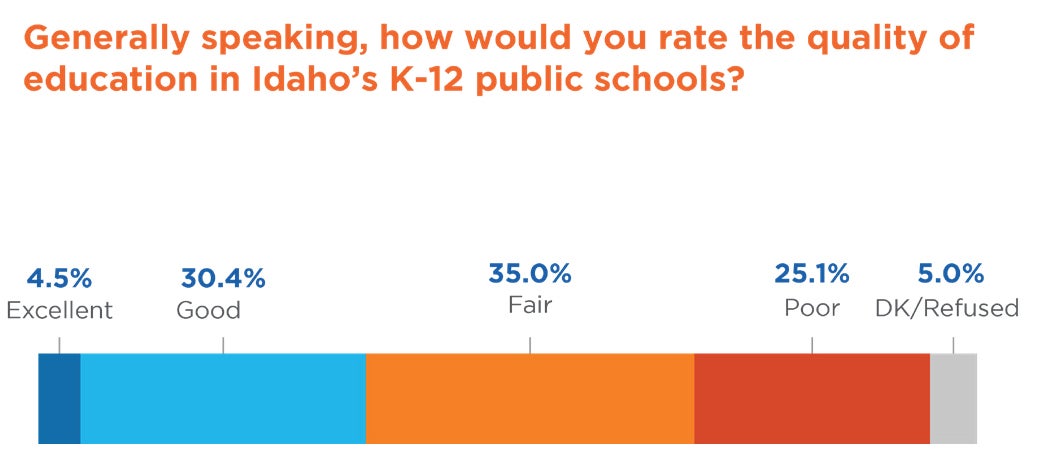
While education has been the focus of much attention at the state level in recent years, attitudes about the quality of K-12 education in Idaho have not improved substantially. A very small number of people (5%) rated education in the state as “excellent,” though almost one in three (30%) rated K-12 education as “good.” The most common response was to evaluate education as “fair” with 35% of respondents selecting this option. Less positively, one in four (25%) respondents said that the quality of education in the state was “poor.” In summary, few think that education in the state is excellent, but people are relatively divided as to whether it is good, fair, or poor.
However, assessments of education in the state as a whole differ from how people feel about the schools in their area. We asked the same question, but instead of focusing on the quality of education in the state of Idaho, we focused on the quality of education “in your area.” When the focus is on education in one’s area, we see more positive evaluations. There are still relatively few who assess the quality of education as excellent (10%), but the most common response (34%) is “good.” There are still a sizeable number who have less upbeat assessments, with 30% believing the quality of education is “fair” and 18% that it is poor. One notable finding is that those who report having children in the K-12 schools have better assessments of the quality of education than those who do not. More than half (55%) of those who have children in school rated the quality of education as excellent or good, compared to 40% rating them as excellent or good among those who do not have children in school.
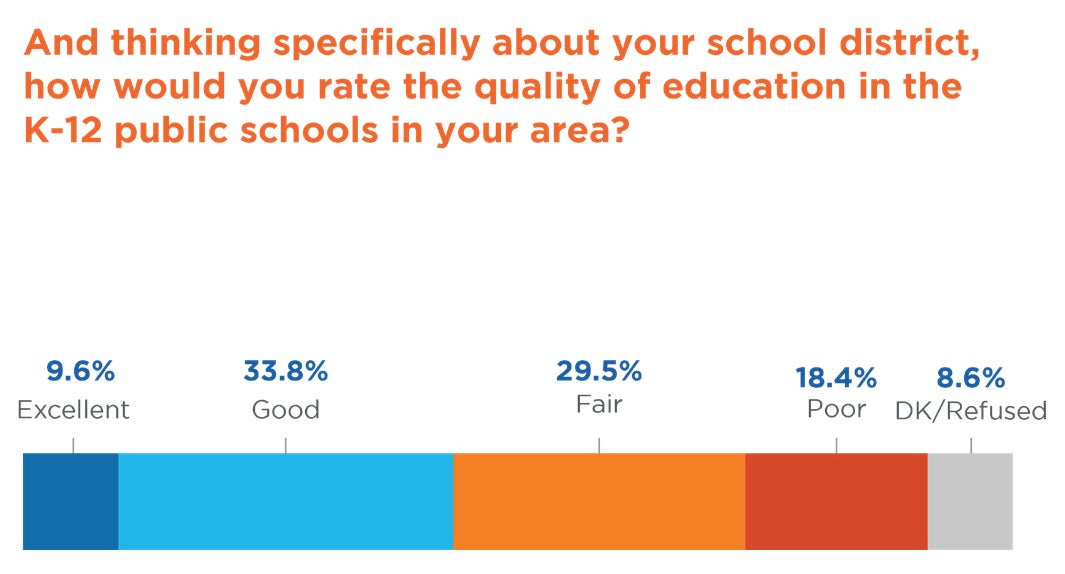
This is the third consecutive year that we have asked this question regarding evaluations of education in one’s area, so we can look to how assessments have changed over time. In general, the attitudes that we see in 2018 are quite similar to those expressed over the prior two years. The one notable change that we observe is a slight increase in the share of respondents who believe that the quality of education is “poor,” increasing from 12% in 2017 to 18% in 2018. Despite this, the overall pattern of results are relatively unchanged.
State law currently prohibits non-resort cities in Idaho from levying tax increases to generate revenue to fund particular projects. Consistent with questions on previous regional surveys, we ask two questions – whether residents think that people should be allowed to vote to decide if they want to implement a local option tax, and whether they would vote in favor of such an increase in their town.
Looking first to whether people think that voters should be able to decide on whether to implement these taxes, we find that citizens are in favor of this by a sizeable margin. 65% of respondents favored letting voters decide whether to implement a local option tax, while 28% opposed. Opposition to allow voters to decide on local option taxes was strongest amongst older respondents (35% of those from 75-84 strongly opposed compared to 8% of those from 18-24). Although Democrats expressed more favorable attitudes, majorities of respondents from both parties favored letting voters decide (75% of Democrats and 61% of Republicans either strongly or somewhat favored). We have asked this question over the past three years, and these responses are essentially unchanged. There has been a slight increase of those who favor allowing voters to decide, but the differences are within the margin of error so we cannot be certain that they are real shifts in attitudes.

Turning to whether people would vote in favor of such a tax if they were presented with it in their city or town, we find more divided responses. One of the challenges of assessing whether people would vote in favor of local option taxes is that there are many different things that these taxes could pay for, and support may vary depending on what kind of project it was funding. As a result, we use a survey experiment again to try and separate general support for a local option tax from support for a local option tax that is used to fund transportation.
Half of the survey respondents received the basic form of the question which asked “And if your town or city were to propose a local option tax, would you favor or oppose that plan?” We find that 48% would favor such a proposal and 39% would oppose it, with a relatively sizeable 13% saying that they don’t know. We saw less support here for actually voting in favor of a local option tax than we saw for the idea that people should be able to vote and decide for themselves in the previous question. The partisan divide is more prevalent in the results to this question than the previous one. A majority of Democrats (64%) stated that they would support this, while less than half of Republicans (41%) would.

The other half of the sample received the same question, but with language added to express that the local option tax was “to support the local transportation system (only).” When framed this way, we saw support for voting for the local option tax increase. Here, we find that 56% would support a local option tax and 35% would oppose it. While these are not dramatic differences from the base question, they do suggest that enacting local option taxes to fund transportation projects are more popular than the concept of local option taxes without a well-defined purpose.
Because raising taxes are not the only means that governments have for funding new projects, we also explored how people in the Treasure Valley viewed other means of paying for projects. One method of funding that has been used for some projects is a public-private partnership. Because of the complex nature of these arrangements, we provided background information to explain how these arrangements might work. When given basic information about public-private partnerships, we found that almost half (48%) of people supported using them, but nearly one in three (31%) responded that they don’t know if they would support their use. This is a relatively high number of “don’t know” responses, likely reflecting the complexity of the issue. A relatively small share (21%) stated that they are not in support of using public-private partnerships.
Another funding arrangement involves using bonding. Because the region is facing demand for facilities improvement to meet law enforcement and public safety needs, we asked respondents about bonding to meet these needs. The question noted that the bonds needed to be approved by a supermajority of voters, and do not raise taxes. When including this information, we found sizeable support (69%), and relatively few who opposed this approach (16%). There are approximately as many people who said that they don’t know (15%) as those who oppose bonding for these facilities.
The last means of raising revenue that we looked at was the implementation of development impact fees for new homes. Again, we provided the respondents with information about what these are, and we mentioned some of the pros and cons – they can generate new revenue, but they may make housing less affordable. We found that almost a majority (48%) supported the implementation of development impact fees, with almost one in three (31%) who opposed them. As we have seen with other questions on the funding topic, there are a large number (21%) who responded that they don’t know.
In summary, we found that residents of the Treasure Valley believe that there are a series of challenges arising from the rapid growth that the region is experiencing. Traffic and the lack of affordable housing are both seen as big problems by the majority of people. Increasing transportation options and funding are popular with residents, but government action to address affordable housing received varied support depending on how the issue was presented. When looking to the funding that would be required to tackle the challenges presented by growth, we found a mixed picture depending on the details of the specific taxes and programs they would fund.
Idaho Policy Institute at Boise State University works across the state with public, private and nonprofit entities. We help articulate your needs, create a research plan to address those needs and present practical data that allows for evidence based decision making. We leverage the skills of experienced researchers and subject-matter experts to respond to the growing demands of Idaho communities.