Report Author
Jeffrey Lyons, Director of Survey Research, Idaho Policy Institute
About the Survey
The Fourth Annual Treasure Valley Survey was conducted September 14th – 22nd, 2019, and surveyed 1,000 adults over the age of 18 who currently live in Ada, Canyon, Boise, Gem, and Owyhee counties. The sample is designed to be representative of the population of the Treasure Valley, with 62% from Ada County, 30% from Canyon County, 4% from Boise County, 3% from Gem County, and 2% from Owyhee County. This was a mixed-mode survey which contacted respondents on land line phones (33%), cell phones (33%), online (33%), and via text message (3%). The goal of using multiple means to contact respondents is to increase our coverage of the population to people who may not respond to traditional phone surveys. This survey focused on growth in the Treasure Valley, along with the issues of transportation, housing, and taxes. The survey has a simple random sampling margin of error of +/- 3.1% and was conducted by GS Strategies Group.
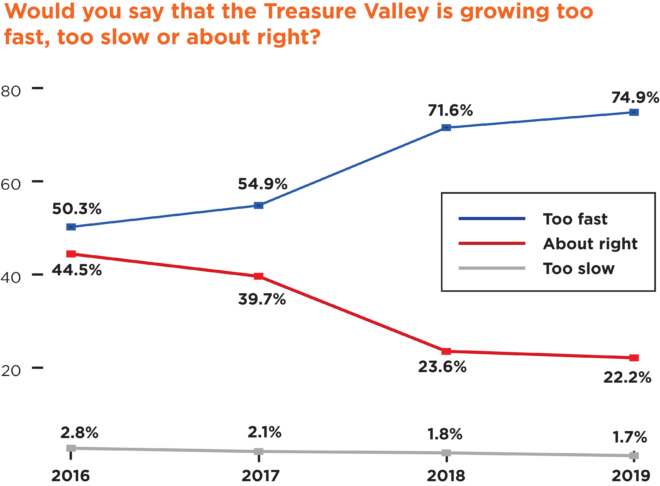
- A sizeable majority of Treasure Valley residents (75%) believe that growth is occurring too fast, a number that is up substantially from the 50% who reported this attitude in 2016.
- The two growth related issues that people are the most concerned with are traffic congestion and affordable housing, which are the same top-two that were reported in 2018.
- Recent arrivals (in the last 10 years) to the Treasure Valley are demographically and politically similar to those who have lived here for a longer period of time, and the most cited reasons that they give for moving here are proximity to family and employment.
- There continues to be broad support (76%) for increasing public transportation options, however a minority (24%) of those who currently commute by driving expressed an openness to taking public transportation themselves if the system were made more efficient.
- The majority of people (66%) do not believe that they would be able to find comparable housing that they could afford if they had to leave their current housing, and renters appear to be especially vulnerable to the financial strains from the increased housing costs that have occurred across the Treasure Valley.
- A majority of people favor government action to address affordable housing (57%), and spending government money to incentivize more affordable housing (60%).
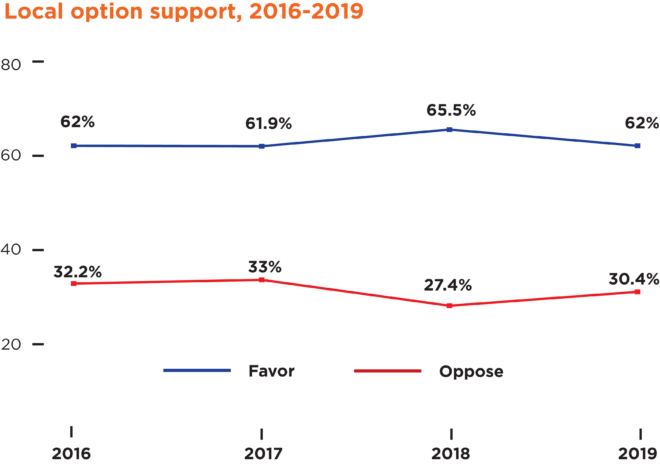
- There continues to be sizeable support (62%) for allowing people to vote on local option taxes, and a majority report being willing to vote in favor of local option taxes to fund transportation-related initiatives.
The Treasure Valley continues to be one of the fastest growing metropolitan areas in the country, and respondents have changed their attitudes about growth substantially over the four years that we have been conducting this survey. We find that 75% of residents of the Treasure Valley believe that growth is occurring too fast, with 22% thinking that the pace of growth is about right, and only 1% saying that growth is too slow. These numbers reflect a substantial change that has occurred since 2016 when we first asked this question and only 50% of respondents felt that growth was occurring too fast. The sentiment that growth is occurring too fast is held by sizeable majorities of all demographic groups, and across all of the geographies within the Treasure Valley.
With these general attitudes about growth in mind, we asked respondents which aspects of growth concerned them the most on a scale from 1 (not at all concerned) to 10 (extremely concerned). Of the elements of growth that people were presented with, increased traffic congestion (73%) and increased cost of living (68%) generated the highest percentage who gave responses from 8-10 on the scale. Only 5% of respondents gave a response of 1-3 for increased traffic congestion, and 6% gave that response for increased cost of living.
The remaining elements of growth generated more modest, but still considerable levels of concern. 52% of people gave an 8-10 rating of concern for overcrowding in the places they frequently visit, 50% for impacts on the environment, 46% for increased crime, 44% for a change in the values and ideas that people have, and 39% for sprawl.
In sum, we see that concerns about growth are most acute in the areas of traffic congestion and the affordability of housing. Before looking at attitudes about these two issues in more depth, we turn to who the new residents are, and what they look like as a group.

Related to growth are a series of questions about who the new residents to the Treasure Valley are, and why they have moved here. We asked people whether they have lived in the Treasure Valley all of their lives, or whether they moved here. For those who indicated that they had moved here, we asked them how long they have lived in the Treasure Valley. With these two pieces of information we are able to compare those who have moved to the Treasure Valley to those who have always lived here, and we are able to look specifically at those who have moved here recently. In our sample of 1,000 people, roughly 73% moved here at some point in their lives, and 29% had moved here in the last 10 years. What does this group of new arrivals to the Treasure Valley look like?
For the purposes of our discussion here we are going to look at those who have arrived in the last 10 years, and compare them to those who have been here for longer than 10 years (which includes both those who have lived here their entire lives and those who moved here more than 10 years ago). Demographically, we see that these two groups are fairly similar in terms of age, income, and education. Those who have moved here in the last 10 years are younger as a group than those who have been here for longer (27% of recent arrivals are between the ages of 18-29, while 6% of those who have been here longer are in the same age range), have very similar levels of educational attainment (43% of recent arrivals have at least a Bachelor’s Degree, as do 46% of those who have been here for longer), and have similar household income levels (32% of recent arrivals have household incomes above $75,000 compared to 35% of those who have been here longer).
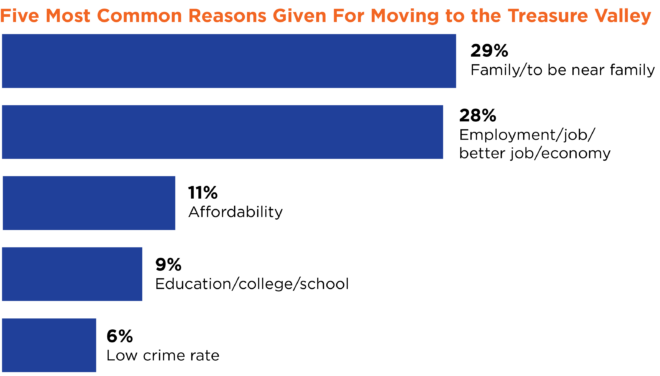
What are the top reasons that recent arrivals give for moving to the Treasure Valley? We asked those who stated that they had moved here to give their top two reasons. We find that being near family is the most frequently stated response, with 29% of those who have arrived in the last 10 years giving that as one of their top two reasons. The second most frequently cited reason was employment, with 28% of recent arrivals mentioning jobs as one if their top two reasons. After these two motivations for relocating to the Treasure Valley, we see a sizeable drop-off in the frequency of the remaining considerations, with affordability/cost of living (11%), education/college (9%), and low crime rate (6%) rounding out the top five reasons that were given.
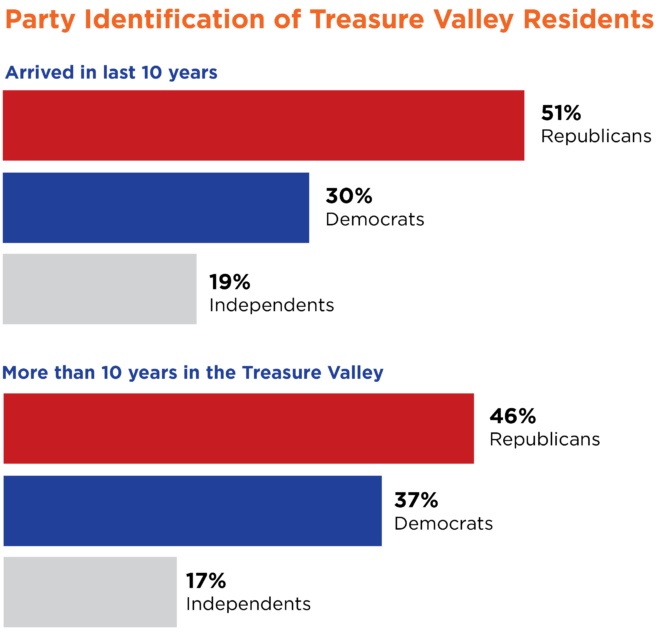
One final question that we looked at regarding the new arrivals is their political orientation, as this has consequences for whether political change (or stability) is likely to follow the influx of new residents. Looking at those who have arrived in the last 10 years, we find that 51% identify as Republicans, 30% identify as Democrats, and 19% as Independents. These numbers are not dramatically different from the group who has been here for longer than 10 years, where 46% identify as Republicans, 37% identify as Democrats, and 17% identify as Independents. These differences between recent arrivals and those who have been here for longer are not statistically significant. Overall, the findings shown here do not point to a changing political landscape in the Treasure Valley as a whole as a result of new arrivals.
In conclusion, when comparing those who have arrived in the last 10 years to those who have been here for longer, the two groups are more similar than they are different. Recent arrivals appear to be a younger group on average, but they have similar levels of education and income, as well as similar political orientations. The most common reasons that they cite for moving to the Treasure Valley are to be near family, and for employment.
Given that traffic and congestion is the element of growth that is most concerning to people, we ask a series of questions about transportation. One change that could be made to transportation in the Treasure Valley would be to increase the number of public transportation options that are available. We find that this idea is quite popular with 76% of respondents believing that we should increase the number of public transportation options that are available, and only 17% who think that there are currently enough options available. Democrats are more likely to believe that there should be more public transportation options than Republicans (90% of Democrats compared to 65% of Republicans), but it is still a majority of all partisan groups who hold this view, and it is a majority of all age groups and geographic regions. This is the fourth year that this question has been asked, and while there has always been majority support for the idea of having more public transportation options, the share who express this view has risen from 67% in 2016 to the 76% that we see in 2019.

In addition to assessing attitudes about public transportation, we look at individual transportation behavior, and people’s prospects of using public transportation to commute to work. First, we asked how people currently commute to work. Almost half (49%) of the respondents commute to work, with the remainder being either retired (36%) or telecommuting from home (13%). Those who commute to work were asked a series of additional questions. Looking first to how they currently commute, 88% of those who commute to work report driving alone, and 6% report carpooling. Very few commuters report biking (2%), walking (2%), or taking the bus (1%) to work.

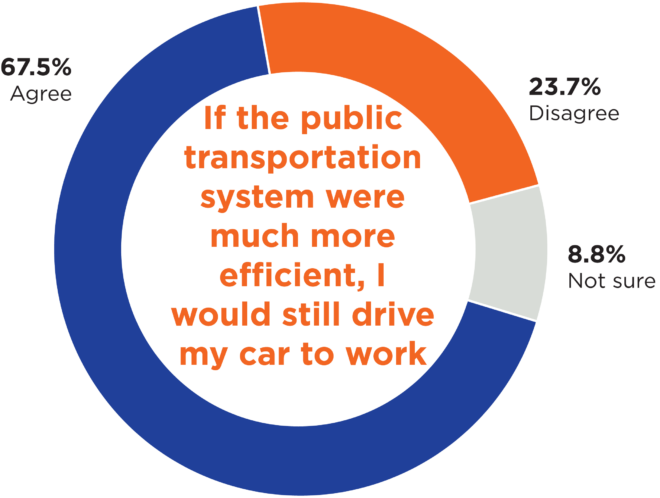
In an effort to see if the people who currently drive to work were open to the idea of taking public transportation, those who stated that they drive alone were asked whether they agreed or disagreed with the statement “Even if the public transportation system were much more efficient than it is today, I would still drive my car to work.” A sizeable majority (68%) of current drive alone commuters agreed that even if the public transportation system were much more efficient, they would still drive alone, with 24% disagreeing, and 9% who were not sure.
Recognizing that part of one’s ability to easily use public transportation is tied to where people live, we also sought to understand whether people make access to public transportation a priority when considering where they choose to live. Only 8% of respondents report that access to public transportation is one of their top three factors in selecting where to live, and 28% express that it is a plus but not a priority. A slight majority (50%) state that access to public transportation is not a priority.
Finally, to see what the tolerance for different commuting times is, all respondents were asked what the maximum length of time is that they would be willing to commute for employment. The most common response (38%) was that they would be willing to commute a maximum of 21-30 minutes, with sizeable numbers also reporting 11-20 minutes (21%) and 31-60 minutes (21%). Few people reported a maximum time of 10 minutes or less (7%) or more than 1 hour (6%).
In sum, residents of the Treasure Valley favor increasing the public transportation options that are available. However, very few report using public transportation currently, and roughly one in four of those who drive alone to work would consider using public transportation if it were made to be much more efficient.
Significant increases in home prices and rents have occurred across much of the Treasure Valley, leading to concerns about the affordability of living in the area. We began exploring the issue of housing by taking a look at current housing patterns among the respondents to the survey. A sizeable majority (77%) report currently living in a single-family home, with much smaller numbers residing in townhomes (6%), condominiums (9%), or mobile homes (4%). Most of the respondents owned their housing (70%), but a sizeable number (28%) were renting.
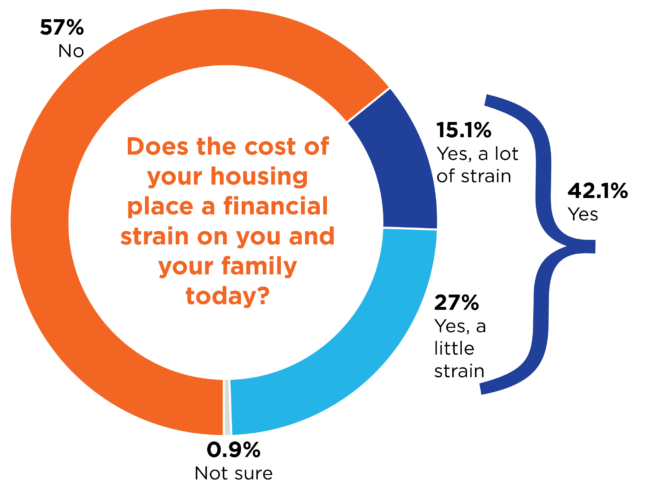
Turning to issues surrounding the affordability of housing, people were asked whether the cost of housing has placed a financial strain on them. We find that a narrow majority (57%) of respondents report that it does not place a financial strain on them, but a sizeable number of people (42%) state that it does place a financial strain on them, and 15% state that it places a lot of strain on them. The impacts of housing costs are not uniform across groups of people – a majority (51%) of those from the ages of 18-39 report that the cost of housing is causing financial strain compared to less than one-third (30%) of those over the age of 65.
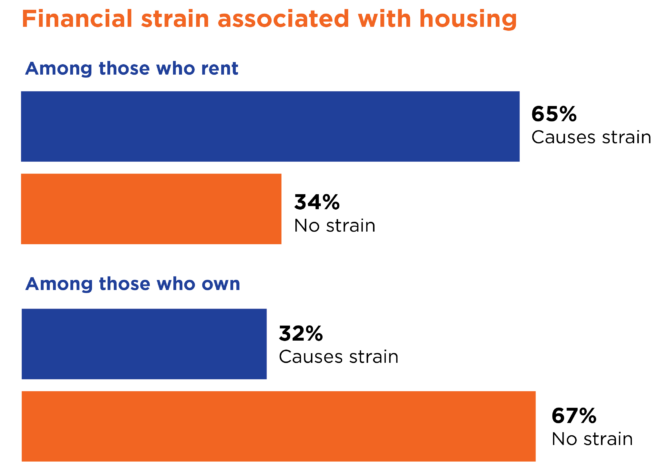
Further, it appears that renters are much more likely to state that the cost of their housing places a financial strain on them compared to owners. 65% of renters report that housing causes a financial strain, including 32% who say it is a lot of strain, while 34% of renters say that the cost of housing does not cause a financial strain. Looking to those who own their housing we see the inverse – 32% report that the cost of housing places a financial strain on them, while 67% report that it does not.
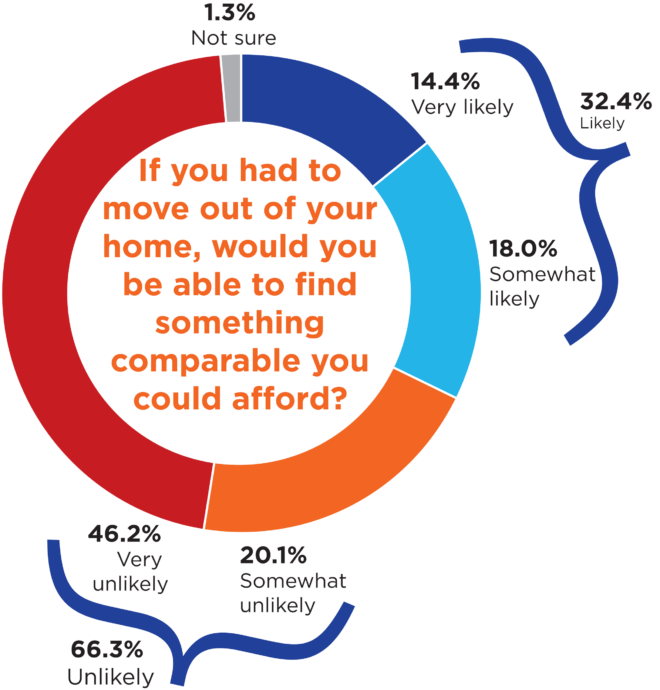
While a majority report that their current housing costs do not place a financial strain on them, people are less optimistic about their prospects for finding something comparable if they had to move. When asked if they would be able to afford something comparable in the event that they had to move, 66% believed that was unlikely, with only 32% believing it is likely that they would be able to afford something comparable. Fewer women report being likely to afford comparable housing than men (37% of men and 28% of women), and more women responded that they would be unlikely to afford comparable housing (70% of women and 62% of men). As we saw with the previous question, renters appear to be in a more precarious housing situation than those who own their homes – 73% of renters believe it is unlikely that they would be able to find something comparable that they could afford if they had to leave their current housing, compared to 63% of those who own their housing.
Turning from individual housing circumstances to assessments of how the Treasure Valley should handle growth, we begin by asking where people think most of the new development should be occurring. The most common response (34%) is that most of the development should be taking place in urban areas where services and infrastructure already exist, but relatively similar numbers expressed that suburban areas should see most of the development (30%), or that rural areas should see the most development (25%).
Although residents of the Treasure Valley do not appear to have a decided preference for where future development should occur, there are some patterns in the kinds of housing developments that could be built. Increasing the density of housing is one option for addressing growth, but it could take a variety of forms ranging from single family houses on small lots, to condominiums and townhomes. To assess people’s attitudes about different kinds of housing, we asked them to rate how they would feel about single-family homes on small lots, townhouses and duplexes, condominiums and apartments, and manufactured and mobile homes being built near where they live on a scale from 1 (not at all favorable) to 10 (extremely favorable).
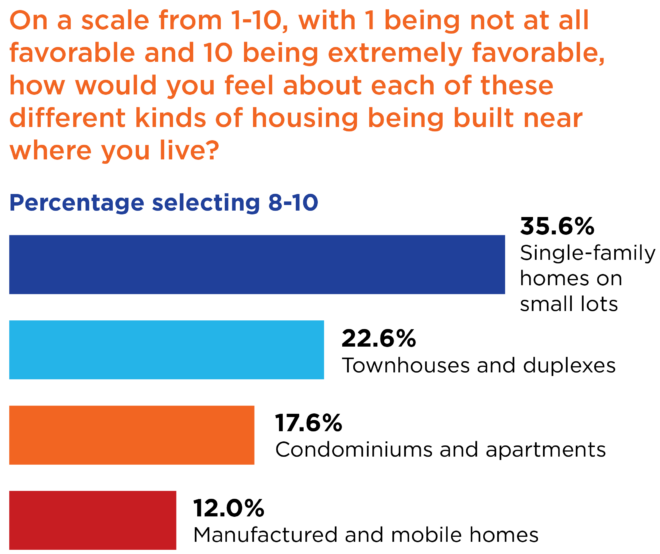
Looking at the percent who report a feeling of 8-10, which is a relatively high level of favorability, we see that single-family homes on small lots are the most well received with 36% giving an 8-10, followed by townhouses and duplexes (23%), condominiums and apartments (18%), and manufactured and mobile homes (12%). In general, these are relatively low percentages who report high levels of favorability for these different housing types. Looking to the other end of the spectrum at those who gave a favorability rating of 1-3, we see that manufactured and mobile homes receive the most negative reaction with 55% of people giving a rating of 1-3, followed by condominiums and apartments (40%), townhouses and duplexes (29%), and single-family homes on small lots (21%).
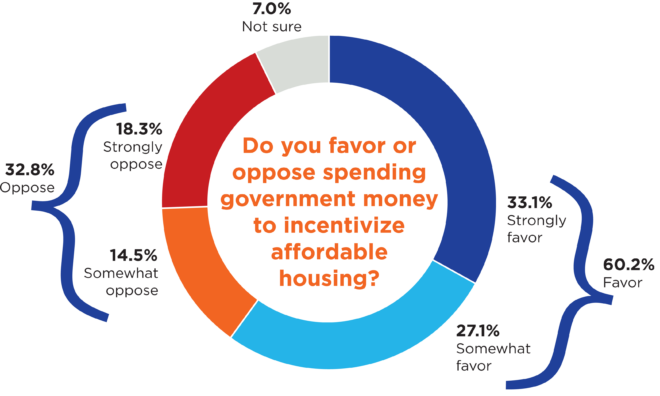
Another component of the housing conversation regards the affordability of housing, and the role that the government may (or may not) play in seeking to keep housing affordable. First, we ask people whether they favor or oppose spending government money to incentivize affordable housing, and find that a majority (60%) favor this compared to one-third (33%) who oppose it. It is worth noting that among the 60% who are favorable towards spending government money to incentivize affordable housing, 33% of them strongly favor it. Majorities of Democrats (87%) and Independents (62%) are in favor, while Republicans are more divided with 44% supporting spending government money to incentivize affordable housing.
Another way to think about this issue is by presenting people with the options of acting to make housing more affordable, or letting market forces determine the price of housing. When presented with these options, we find that 57% favor action being taken, and 33% side with allowing market forces to determine the price of housing. We followed up with the 57% who support action being taken and asked who they believed should act. When presented with the options of the government, the private sector, non-profit organizations, or all of the above, we see that the government emerges as the most popular entity that should act. A majority (56%) selected the government alone, and with 20% who said “all of the above,” the percentage who supported government action was 76% of those who supported action as opposed to market forces. There was also substantial support for the private sector acting, with 31% selecting that option alone, and when adding the 20% who responded “all of the above,” there were 51% of those who prefer action to be taken as opposed who expressed a preference for private sector action. Fewer (18%) selected non-profit organizations alone, which amounts to 38% when adding in the “all of the above” responses.
In sum, we find that there are a sizeable percentage of Treasure Valley residents (42%) who report that the cost of their housing places a financial strain on themselves and their family, and a majority (66%) think that it is unlikely they would be able to find comparable housing that they could afford if they had to move out of their home. Looking at the kinds of high-density housing that could be built to address housing needs, people are most favorable to single-family homes on small lots being built near where they live, and less favorable to townhomes, condominiums, and mobile homes. Finally, a majority of people (60%) are generally supportive of the government acting to help address the affordable housing issue in the Treasure Valley.
Underlying discussions of how local governments should respond to growth is the question of how to raise revenues to tackle some of these challenges. We focus here on people’s support for local option taxes. These taxes are currently not allowed under Idaho law across most of the state, but are often referenced by local governments as a tool that they could use to raise revenues for transportation or housing initiatives. Recognizing that these taxes are not currently allowed, we first look to whether residents of the Treasure Valley believe that they should be allowed to vote on a local option tax. This is the fourth year that we have asked this question, and we find that support for allowing people to vote on local option taxes remains high at 62% in favor. This number is essentially unchanged from last year where we found 65% in favor, suggesting that support is relatively stable. Majorities of Democrats (74%), Independents (66%), and Republicans (55%) favored allowing people to vote on local option taxes, as did majorities of all age groups and geographies across the Treasure Valley.
While people appear to support being given the ability to vote on these measures, that does not tell us whether they would actually cast a ballot in favor of a local option tax increase. We explore two possible kinds of initiatives that local option taxes could be used to fund – improvements in public transportation, and road and bridge improvements. Rather than asking two separate questions, we randomly split the sample of 1,000 respondents into two groups of 500 each, and ask each group a slightly different version of the question. One group was asked whether they would favor or oppose a local option tax to pay for public transportation improvements, while the other was asked if they would favor or oppose a local option tax to pay for road and bridge improvements.
We find that majorities would vote in favor of a local option tax for both options. 54% of respondents report that they would vote in favor of a local option tax to pay for public transportation improvements, and 59% would vote in favor of a local option tax to pay for road and bridge improvements. The difference between these two numbers is within the margin of error, so we are not able to say there is more support for local option taxes to fund road and bridge improvements than public transportation improvements.
In sum, majorities across the Treasure Valley remain in favor of allowing people to vote on local option taxes, which is currently not permitted under state law. Further, we see that majority support remains when people are asked whether they would vote in favor of a local option tax to fund both public transportation improvements as well as road and bridge improvements in their town. With this in mind, we recognize that support would likely fluctuate depending on the magnitude of the tax increase that was proposed, which we do not explore here.

Growth presents a host of challenges to local governments, and with some people increasingly concerned about the effects of growth, communication between residents and governments is likely to be important for reaching the best solutions. We sought to understand whether people in the Treasure Valley feel like their local governments welcome input from residents, and act upon the input that they receive. Looking first to the question which asks whether their town or city welcomes input from residents, we find that a majority (65%) agree that their town or city welcomes input from residents, with 27% disagreeing with that statement.
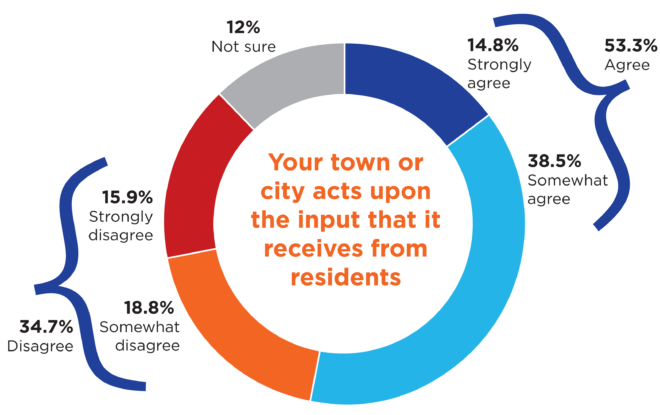
When looking at whether people think that their town or city acts upon the input they receive from residents, we find that 53% of respondents agree with this statement, and 35% disagree. Although a majority agree, this is fewer than believed that their local governments welcome input.
Across both questions it appears as though majorities hold positive assessments regarding local government responsiveness to citizens, though fewer people believe that their government acts upon the input they receive compared to those who believe that they welcome input.
As the rate of growth in the Treasure Valley remains one of the highest in the nation it is no surprise to see that issues related to this increase in population are on the minds of the people who live here. The majority see our current rate of growth as too fast, and point to traffic congestion and affordable housing as the most concerning issues that they face. While policy solutions are undoubtedly more complex than the questions we are able to ask on a survey, there does appear to be general support for some potential solutions to the challenges that the region faces.
Fourth Annual Treasure Valley Survey
School of Public Service: Andy Giacomazzi, Interim Dean
Idaho Policy Institute: Greg Hill, Director; Vanessa Fry, Research Director
Report Author: Jeffrey Lyons, Director of Survey Research, Idaho Policy Institute
Idaho Policy Institute at Boise State University works across the state with public, private and nonprofit entities. We help articulate your needs, create a research plan to address those needs and present practical data that allows for evidence based decision making. We leverage the skills of experienced researchers and subject-matter experts to respond to the growing demands of Idaho communities.
