Hispanic Statewide Healthcare Plan
Report Authors
- Maria Onaindia, MAT, Research Associate
- Libbie Luevanos, Research Intern
This report was prepared by Idaho Policy Institute at Boise State University and commissioned by the Idaho Commission on Hispanic Affairs.
Recommended citation: Onaindia, M., & Luevanos, L. (2025). Hispanic statewide healthcare plan. Idaho Policy Institute. Boise, ID: Boise State University.
Download a printable pdf of this report
Acknowledgements
Thank you to the organizations and individuals who contributed to the first Hispanic Statewide Healthcare
Plan. We would like to acknowledge the following partners:
We recognize researchers with the Idaho Policy Institute: Maria Onaindia; Research Associate; Libbie Luevanos, Research Intern. Additionally, we recognize Idaho National Laboratory members: Ms. Kimberly R. Waetje and the team, who were especially generous with their time and expertise.
Blue Cross Foundation for Health, Kendra Witt-Doyle, Executive Director, for their ongoing support and financing of this report.
Bobby Gaytan from BlakBook designed the cover art.
Thank you to all the participants of the 2024 Hispanic/American Indian Healthcare Conference and the planning committee members:
Mercedes Munoz, Alzheimer’s Association | Greater Idaho Chapter; Holly Sue Kerns, Blue Cross of Idaho; Kendra Witt-Doyle, Blue Cross of Idaho Foundation for Health; Arnold Cantu, Community Family Clinic; Maria Alvarez, Conéctate; Shaina Cales, Delta Dental of Idaho; Tiffany Robb, Idaho Department of Health & Welfare | Alzheimer’s Disease and Related Dementias; Megan Richards, Idaho State University; Leticia Herkshan, Idaho State University; Roberta Jose-Bisbee, Nimiipuu Health; Laura Salazar, Saltzer & Intermountain Healthcare; Maggie Mann, Southeastern Idaho Public Health; Glenda Gonzalez, St. Alphonsus Regional; Dr. Alejandro Necochea, St. Luke’s Health System; Diana Gomez Romero, St. Luke’s Health System; Vicky Jekich, St. Luke’s Health System; Dr. Gina Clarkson, Idaho State University’Kasiska Division of Health Sciences. Palina Louangketh, Bureau Chief, Equity and Strategic Partnerships | Tribal Liaison, Division of Public Health.
Mission Statement
The Idaho Commission on Hispanic Affairs is a non-partisan state agency. The Commission provides services to the Hispanic community and serves as a liaison between the community and government entities. We work toward economic, educational, and social equality. The Commission identifies and monitors programs, legislation, and research problems and issues facing Idaho’s Hispanic community. The Commission identifies solutions and provides recommendations to the governor, legislature, and other organizations concerning issues facing the state’s Hispanic population.
Vision Statement
To be seen as a state agency that is a catalyst for providing focus, leadership, and advocacy leading to self-reliance for Idaho’s Hispanic population.
Contact Information for Idaho Commission on Hispanic Affairs
2399 S. Orchard Street, Suite 204
Boise, ID 83705-3794
(208) 334-3776
icha.idaho.gov
Return to the beginning of the report
Hispanic Population of Idaho
Idaho’s Hispanic population, which comprises 13.8% of the state overall, is responsible for 22% of Idaho’s population growth over the past decade.1 The majority of Hispanic individuals are in Southwestern Idaho.
Hispanics are disproportionately younger when compared to Non-Hispanics. As seen in Figure 2, 64.9% of Hispanics are below the age of 35 while only 43.6% of Non-Hispanics are.
Over the past decade Hispanic people, like many other Idahoans, have experienced increased income, decreased unemployment, and decreased crime. While there is still work to do in these areas, education and healthcare have not experienced the same positive trend.
In 2023, 10.9% of Idaho’s population aged 0-64 had no health insurance. This proportion is more significant for Hispanic individuals within the state. Nearly 1 in 5 (18.6%) Hispanic Idahoans had no health insurance in 2023. Figure 3 shows that the rate at which Hispanic individuals are uninsured has been consistently higher than others in the state over time. Uninsured individuals are at higher risk of bankruptcy, poorer health outcomes, and higher medical costs.2
Differences in health outcomes between Hispanic and Non-Hispanic Idahoans observed over time demands an examination of the current healthcare experience for these communities across Idaho.
Figure 1: 2023 Total Idaho Hispanic Population by County
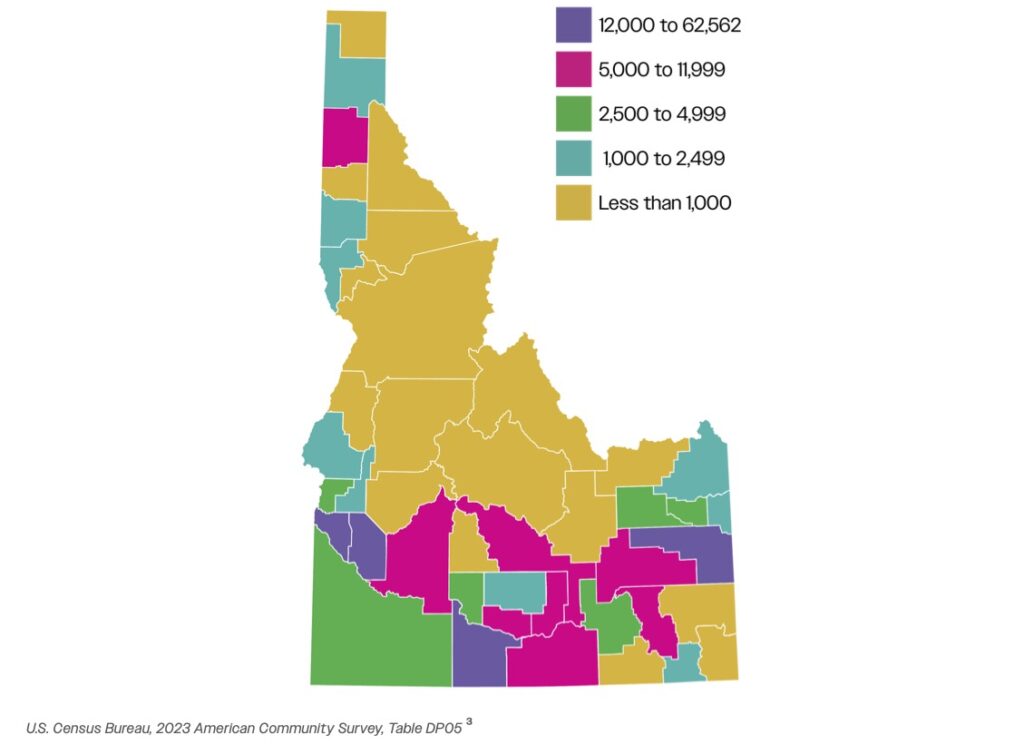
Figure 2: 2023 Age Distribution of Hispanic vs Non-Hispanic Idahoans
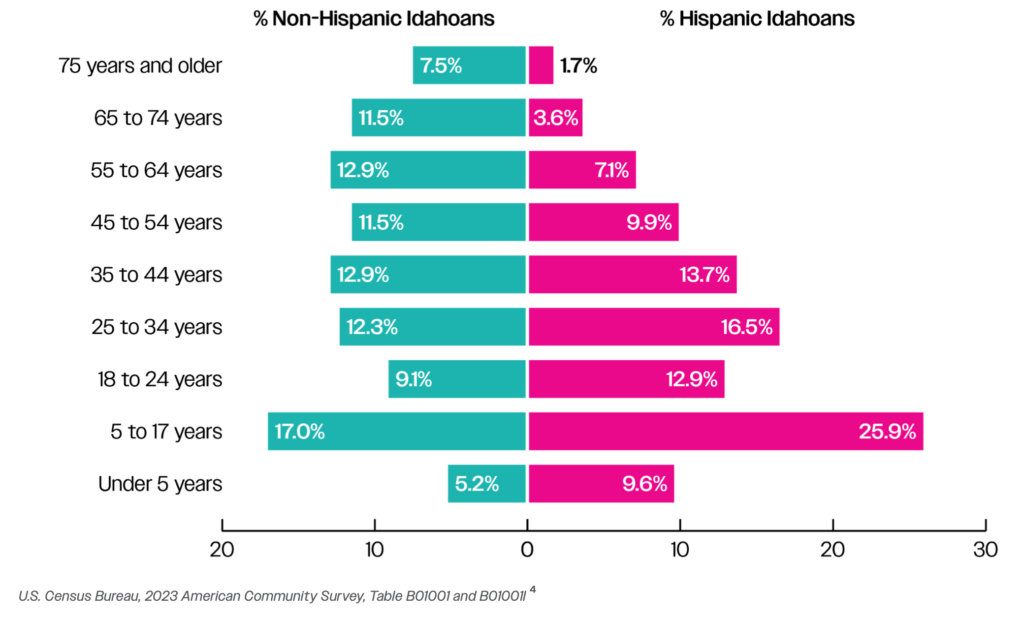
Figure 3: Percentage Uninsured in Idaho (Age 0-64) – Hispanic vs Overall
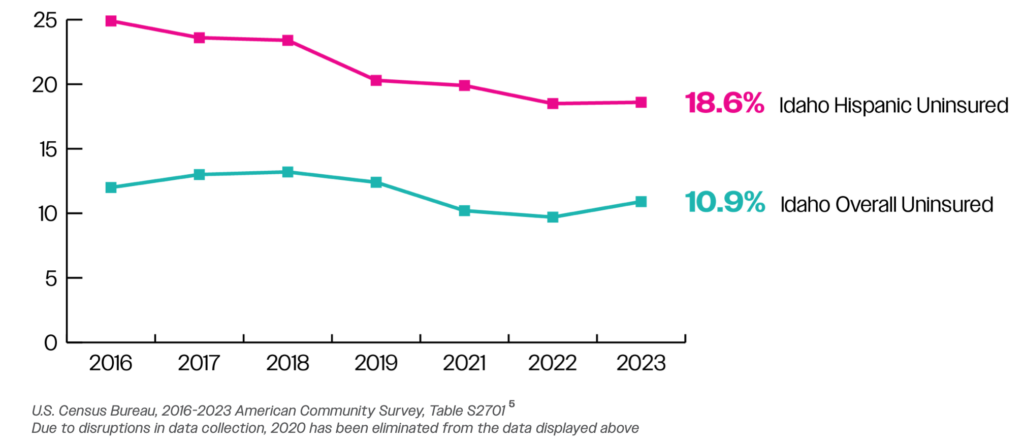
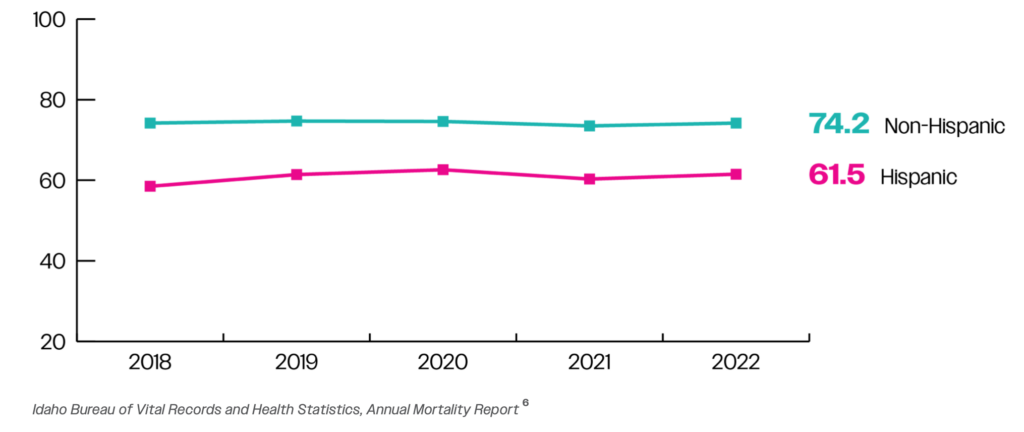
Figure 4: Average Age of Death in Idaho – Hispanic vs Non-Hispanic
Return to the beginning of the report
Methodology
The recommendations and analysis to follow were guided by survey responses and supplemented with secondary data that is publicly available.
In July 2024 focus groups were conducted at the 2nd Idaho Hispanic/American Indian Healthcare Conference hosted by the Idaho Commission on Hispanic Affairs (ICHA). Focus group participants were conference attendees from all over the state. Participants were elected officials, healthcare workers, Hispanic and Native American community leaders, and other individuals invested in healthcare solutions for Idaho. In total, 27 pages of data were processed from these focus groups, this included nearly 400 individual responses generated from 4 questions. Participants were asked the following questions:
- How can the healthcare system earn the trust of marginalized communities?
- How would you like to see organizations spending their operating dollars to best serve underrepresented communities?
- What work can we do in our own communities and circles to dismantle these long-standing inequities?
- How can we turn this moment into a movement?
From the 400 responses, themes were identified and used to form three focus areas. The three areas of focus are components of the Hispanic healthcare experience that applied to the majority of individual responses collected. They are:
- Improving Accessibility to Care
- Expanding the Healthcare Workforce in Idaho
- Engaging Idaho Communities
The 400 responses were sorted into the three focus areas listed above and consolidated when appropriate. Since every recommendation given by the focus groups doesn’t apply to every consumer of the information, we sorted recommendations according to the decision-maker that would be best positioned to put the recommendation into practice. The individuals we considered were:
- Government (Includes legislators, state agencies, and other state-run organizations within Idaho)
- Healthcare Facilities/Providers
- Insurance Companies/Employers
- Nonprofits/Other
- All (Recommendations appropriate for all groups listed)
A table with the sorted action steps appropriate for each of the groups above is included in each section of this report.
Secondary data was collected through a variety of trusted sources to inform which recommendations made by the focus group to elevate. Data was successfully gathered from sources such as the US Census, Idaho Department of Health & Welfare, and the Association of American Medical Colleges, but is limited. The limitations of data are especially apparent when aiming to find information for individuals of Hispanic ethnicity in Idaho. To inform future research and policymaking, additional data collection at the state and local level is needed. The needs of all 44 counties in Idaho and the communities within them are distinct and without more specific information, decision-makers will not be able to target solutions to longstanding issues and improve the lives of all Idahoans.
Return to the beginning of the report
Improving Accessibility to Care
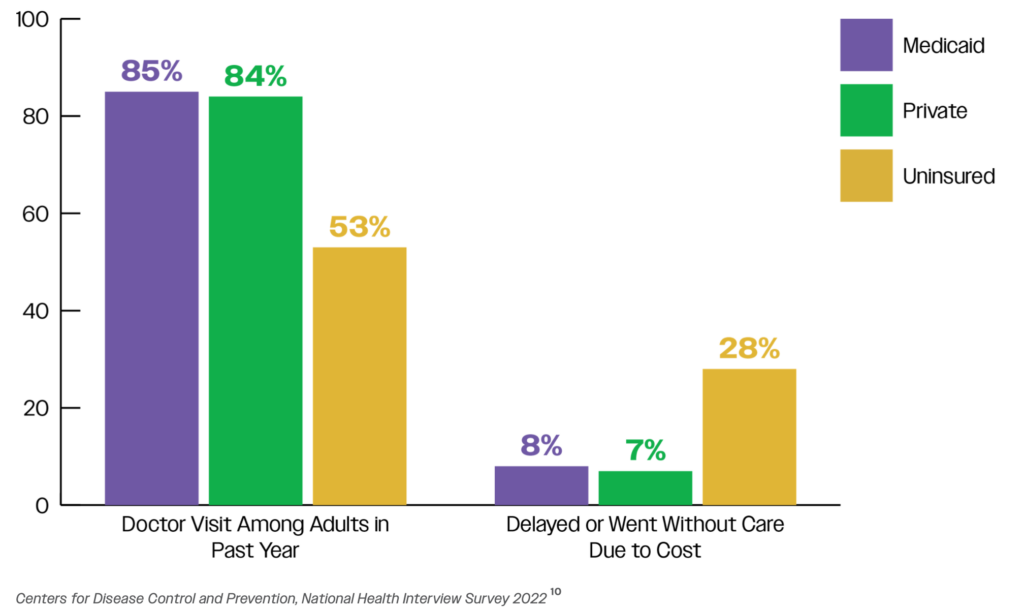
Accessibility to care can be defined in many ways, from ensuring information is available to patients in the appropriate language to guaranteeing government assistance to those that qualify. Medicaid services have historically been provided to Idahoans in need. Wide support for this program was demonstrated in 2018 when 61% of Idahoans voted to expand Medicaid eligibility to Idahoans under 65 with incomes at or below 138% of the poverty limit.7 The Centers for Disease Control and Prevention found through its National Health Interview Survey in 2022 that individuals with Medicaid coverage behave similarly to those with private insurance when it comes to seeking routine and prompt care. This behavior is critical to reduce the occurrence of expensive medical emergencies where the burden of cost falls on Idahoans least equipped to pay and Idaho medical facilities.
Figure 5: Healthcare Behavior by Insured Status
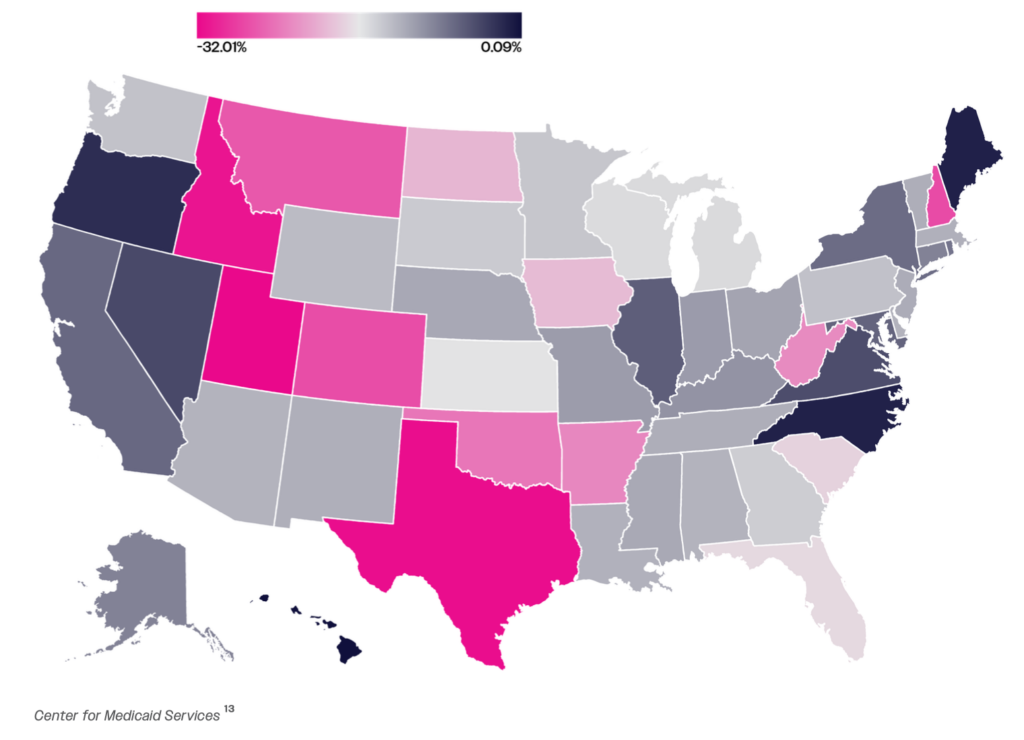
A COVID-19 relief law that was enacted by Congress in 2020 prohibited all states from removing people from Medicaid except in a few narrow circumstances (death or an individual moved out of state). Beginning in April 2023, states were allowed to start removing people from Medicaid after a three-year pause period. In March 2023, automatic Medicaid re-enrollment was also suspended. Idaho pursued a fast timeline for resuming Medicaid eligibility reviews, known as Medicaid unwinding. Idaho’s Medicaid population declined at the third sharpest rate of all states, falling by 31% during Medicaid unwinding.8
Figure 6: Medicaid Enrollment Declines Across the U.S. March 2023 – March 2024
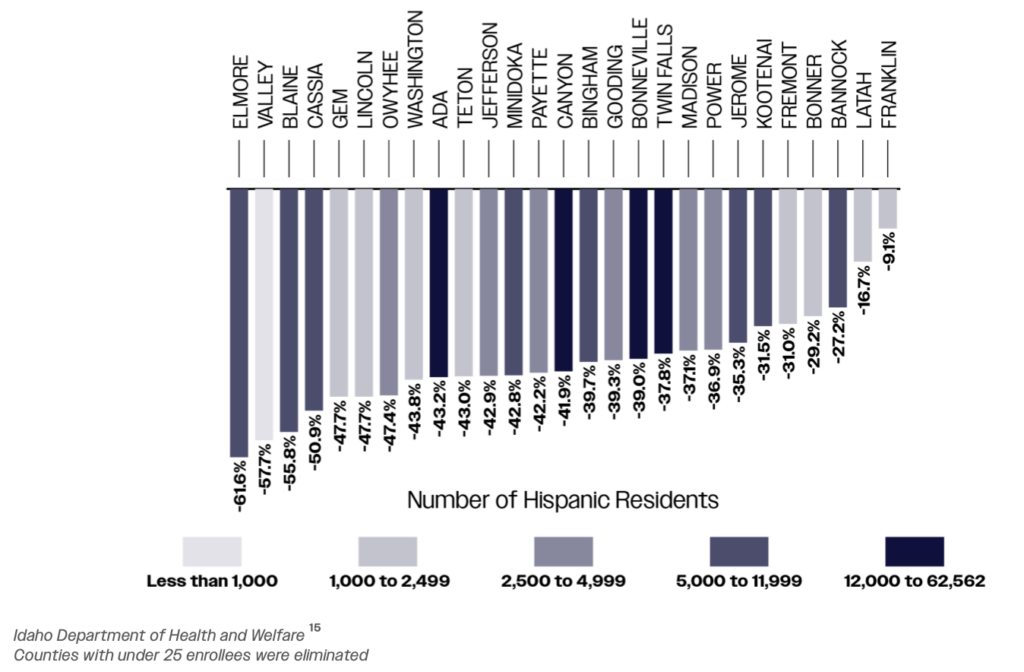
Idaho officials were unable to confirm everyone they removed from Medicaid was ineligible due to changes in income. Approximately 73% of Idahoans lost Medicaid for not replying to the state’s requests for information, labeled procedural removals.9 While these removals impacted communities across the state, this impact is stark when considering Hispanic communities within Idaho. Figures 6 & 7 show the decline observed amongst Hispanic adults enrolled in Medicaid as well as Hispanic children enrolled in the Child Health Insurance Program (CHIP). The impact of unwinding was more severe in certain counties for Hispanic enrollees. Counties like Elmore and Blaine have experienced a more significant decline in enrollment for Hispanic children and adults, respectively. Across the state, the number of Hispanic enrollees has not recovered from the unwinding seen in 2023.
Figure 7: Number of Hispanic Individuals Enrolled in Medicaid
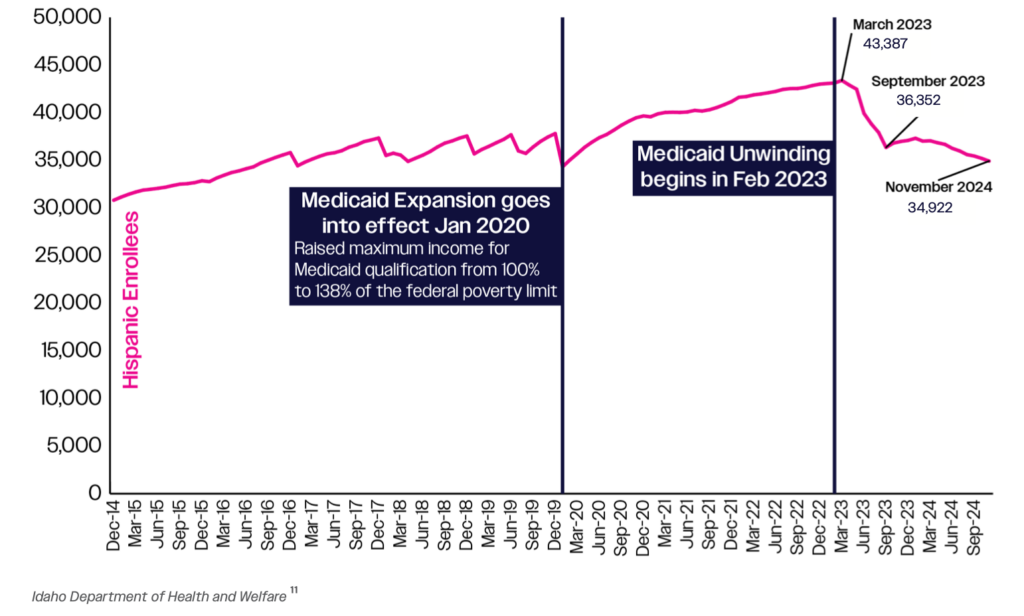
Figure 8: Number of Hispanic Children Enrolled in CHIP
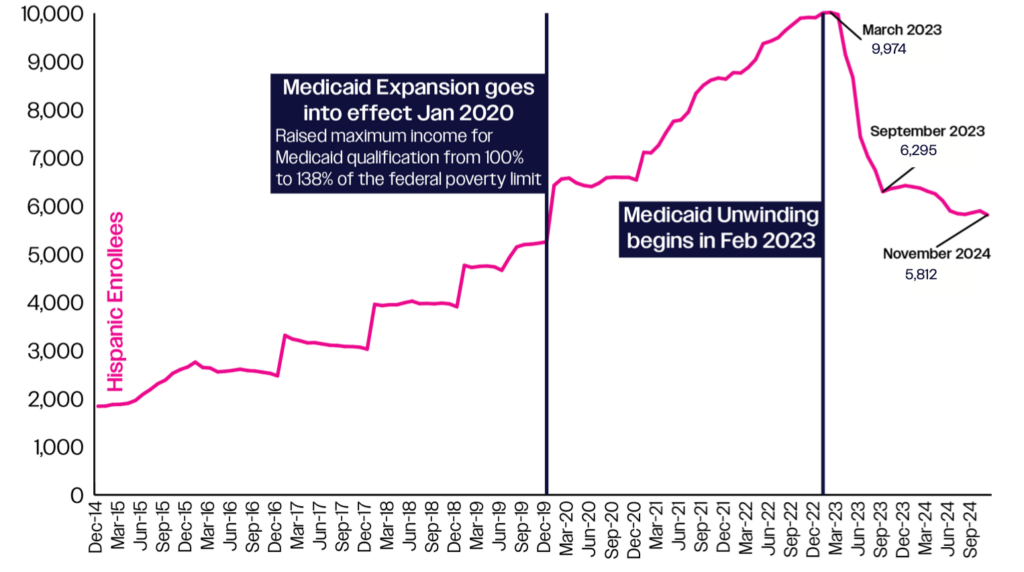
Figure 9: Change in Medicaid Enrollment by Hispanic Population for March 2023 to November 2024
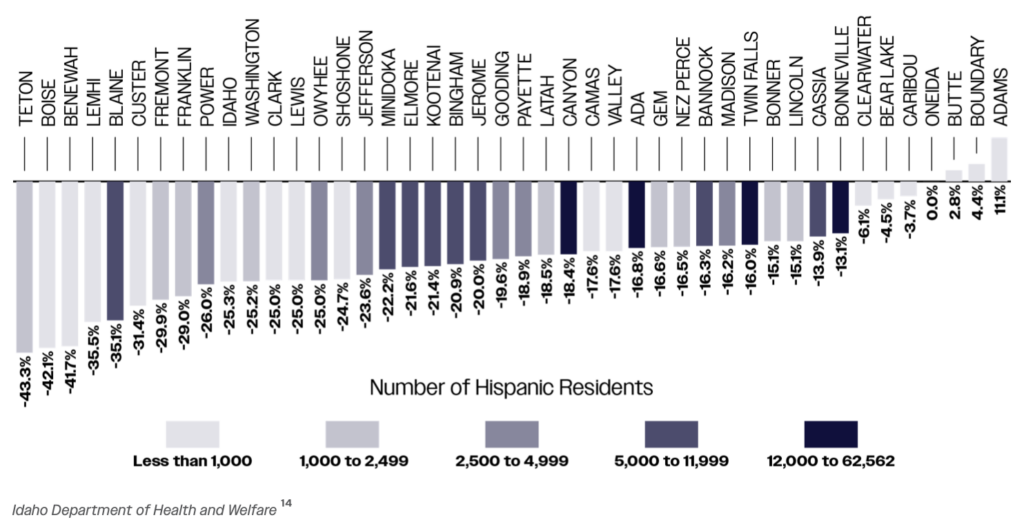
Figure 10: Change in CHIP Child Enrollment by Hispanic Population for March 2023 to November 2024
Despite the ability of eligible Idahoans to re-enroll, enrollment remains challenging for working Hispanic families and those unsure how to navigate a complex process. Further outreach is necessary to ensure all eligible Idahoans have coverage. The table below depicts actions the community has deemed necessary to improve accessibility to care within Hispanic communities.
Table 1: Actions to Improve Healthcare Accessibility within Hispanic Communities
| Government | Healthcare Facilities / Providers | Insurance Companies / Employers | Nonprofits / Other | All |
|---|---|---|---|---|
|
|
|
|
|
Return to the beginning of the report
Expanding the Healthcare Workforce in Idaho
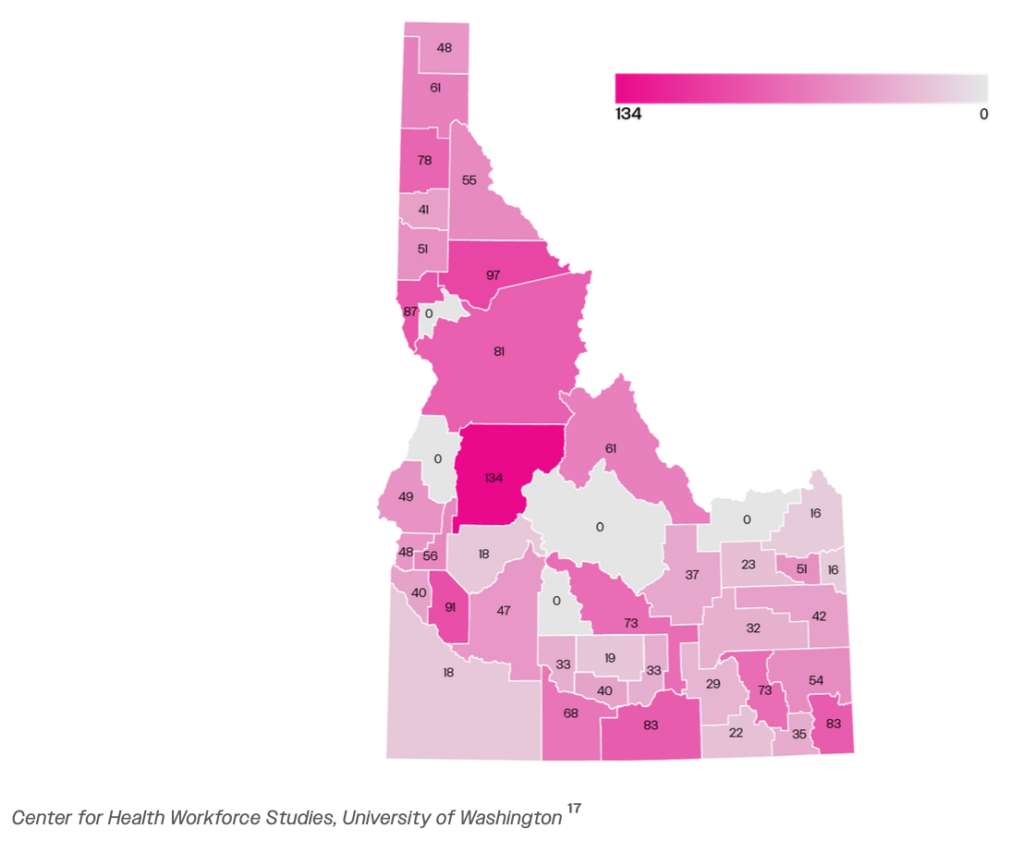
Having a robust healthcare workforce continues to be a priority for Idaho and the current lack thereof has consequences for all Idahoans, including the Hispanic population. Idaho falls well below the national average in terms of Physicians and Primary Care Physicians per 100,000 people. Like Medicaid unwinding, the impact of an insufficient healthcare workforce is felt in certain counties more than others. Counties with substantial Hispanic populations like Jerome, Canyon, and Bingham have nearly half as many available Primary Care Physicians per capita when compared to the Idaho average as seen in Figure 12.
Figure 11: Idaho Compared with National Estimates of Physicians per 100,000 people, 2021
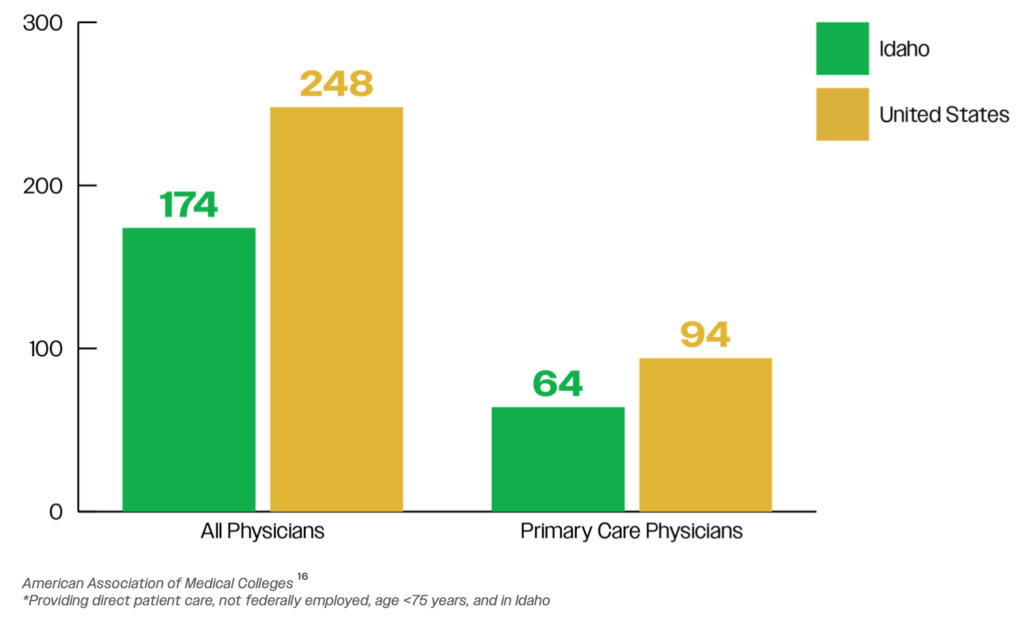
Figure 12: Primary Care Physicians per 100,000 people
Within Idaho’s current healthcare workforce, only 1% of nurses and 3% of doctors are Hispanic. This is well below the nearly 14% of Idahoans that are Hispanic. This presents an opportunity to grow a workforce that reflects the diversity of Idaho and can better serve its citizens.
Table 2: 2022 Nurse Demographic and Educational Data
| LPN | RN | CNP | CRNA | CNM | CNS | |
|---|---|---|---|---|---|---|
| White/Caucasian | 2,825 | 17,064 | 1,569 | 419 | 68 | 38 |
| Asian | 61 | 448 | 43 | 5 | 0 | 1 |
| Hispanic/Latino | 29 | 210 | 11 | 3 | 1 | 0 |
| Other | 148 | 579 | 46 | 12 | 0 | 0 |
| American Indian | 70 | 252 | 19 | 7 | 0 | 0 |
| Black/African American | 29 | 28 | 12 | 2 | 2 | 0 |
| Native Hawaiian or Other Pacific Islander | 15 | 69 | 7 | 2 | 0 | 0 |
| Total | 3,177 | 18,650 | 1,707 | 450 | 71 | 39 |
Source: Idaho Center for Nursing 2022
Figure 13: 2022 Nurse Demographic and Educational Data
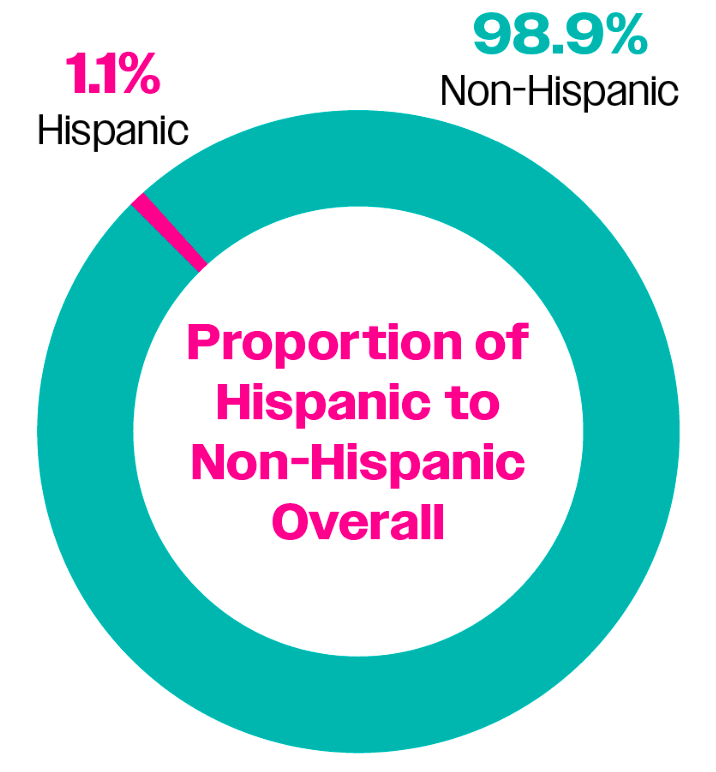
Table 3: 2020 Active Physicians & Surgeons per 100,000 people
| ID | ID Rank | State Median | |
|---|---|---|---|
| Active Physicians per 100,000 People | 196.1 | 50 | 272.0 |
| Total Active Patient Care Physicians per 100,000 People | 183.8 | 49 | 239.8 |
| Active Primary Care Physicians per 100,000 People | 74.3 | 45 | 94.7 |
| Active Patient Care Primary Care Physicians per 100,000 People | 69.1 | 45 | 84.5 |
| Active General Surgeons per 100,000 People | 5.5 | 50 | 7.7 |
| Active Patient Care General Surgeons per 100,000 People | 5.3 | 49 | 7.0 |
| Percent of Active Physicians Who Identify as Hispanic, Latino or of Spanish origin | 3.0% | 31 | 3.2% |
Source: American Association of Medical Colleges, Idaho Physician Workforce Profile
Recommendations outlined below target both hiring a workforce that looks more like the individuals they serve as well as incentivizing young Idahoans to pursue a healthcare career within Idaho.
Table 4: Workforce Recommendations
| Government | Healthcare Facilities / Providers | Nonprofits / Other | All |
|---|---|---|---|
|
|
|
|
Return to the beginning of the report
Engaging Idaho Communities
Community Engagement was one of the main themes identified from the 400 individual responses. These responses were a mix of a call to action, as well as appreciation and support for currently established programs and positions. One such position was that of Community Health Workers (CHWs) whose role is connecting patients, healthcare providers, and community resources in both clinical and community-based settings. Their role allows for the creation of trust and a relationship between the community and healthcare organizations. Currently there are 410 CHWs working throughout the state of Idaho per the Idaho Department of Labor. Proportionately this means that 0.373 of every 1,000 jobs in Idaho are for CHWs, highlighting an opportunity to create and hire for more of these positions.
Respondents emphasized the importance for their community to be included in the decision-making process when institutions are determining where to focus their efforts. When communities are invited to the table, they can guide decision makers in the right direction and ensure resources are not wasted. Education for patients based around their rights was another area where respondents highlighted a need within their community. Ability to understand and fully exercise patient rights when it comes to healthcare, health insurance, and government programs is a way to decrease health disparities for all Idahoans as well as the Hispanic community.
Table 5: Community Engagement Recommendations
| Government | Insurance Companies / Employers | Nonprofits / Other | All |
|---|---|---|---|
|
|
|
|
Table 6 shows that while Medicaid outreach is necessary across the state, the urgency of that need differs depending on county. This is one example that demonstrates the need to collect local data. By collecting relevant regional data, working with trusted organizations, and speaking to citizens of different demographics across their county, decision-makers will be able to pursue solutions unique to their constituents instead of one approach for the entire state.
Table 6: Idaho Percentage Uninsured Overall and Percentage Below 138% Poverty Limit Uninsured
| County | % Uninsured Overall | % below 138% Poverty Limit Uninsured |
|---|---|---|
| Idaho | 18.4% | 18.4% |
| United States | 11.2% | 20.7% |
| Clark County | 25.9% | 35.6% |
| Gooding County | 21.9% | 28.0% |
| Owyhee County | 20.1% | 24.6% |
| Jerome County | 19.7% | 28.5% |
| Power County | 17.9% | 24.9% |
| Minidoka County | 17.4% | 24.9% |
| Lincoln County | 16.9% | 25.5% |
| Cassia County | 16.2% | 23.5% |
| Boundary County | 16.1% | 20.9% |
| Benewah County | 16.0% | 19.1% |
| Teton County | 16.0% | 29.8% |
| Blaine County | 15.9% | 31.7% |
| Camas County | 15.9% | 26.3% |
| Fremont County | 15.9% | 23.6% |
| Payette County | 14.4% | 21.3% |
| Canyon County | 14.3% | 21.6% |
| Custer County | 14.3% | 19.2% |
| Lemhi County | 14.3% | 18.5% |
| Elmore County | 13.9% | 19.4% |
| Lewis County | 13.7% | 15.8% |
| Bingham County | 13.3% | 18.5% |
| Idaho County | 13.3% | 16.9% |
| Twin Falls County | 13.3% | 19.6% |
| Adams County | 13.0% | 18.0% |
| Gem County | 12.8% | 19.2% |
| Bonner County | 12.6% | 18.7% |
| Shoshone County | 12.5% | 15.3% |
| Valley County | 12.3% | 20.7% |
| Butte County | 12.1% | 17.9% |
| Franklin County | 12.0% | 18.7% |
| Jefferson County | 11.9% | 21.5% |
| Washington County | 11.2% | 15.9% |
| Bonneville County | 11.1% | 17.6% |
| Caribou County | 11.1% | 17.8% |
| Clearwater County | 10.8% | 16.7% |
| Kootenai County | 10.8% | 17.4% |
| Nez Perce County | 10.8% | 16.5% |
| Boise County | 10.6% | 19.8% |
| Bear Lake County | 10.4% | 17.6% |
| Oneida County | 10.2% | 17.5% |
| Madison County | 9.9% | 12.4% |
| Bannock County | 9.6% | 14.1% |
| Latah County | 8.4% | 13.2% |
| Ada County | 8.1% | 16.4% |
Source: Census Bureau and Small Area Health Insurance Estimates
Return to the beginning of the report
Looking Forward
Providing high-quality healthcare services to the Hispanic population within Idaho is critical for the state’s future success. Access to healthcare leads to improved health outcomes, longer lifespan, higher quality of life, and reduced healthcare costs among several other benefits. The gaps currently observed will not be closed through any one action taken by any one group of individuals, it will demand a collective effort. While examination of the health gap in Idaho is important for all counties, counties with the highest Hispanic populations have an opportunity to lead the effort. ICHA commits to being a future partner and facilitator aimed at bringing together individuals across the state to work towards creating a superior healthcare experience for all Idahoans.
Return to the beginning of the report
Endnotes
1 U.S. Census Bureau, 2023 American Community Survey, Five-Year Estimates. Retrieved from http://data.census.gov
2 Hadley, J. (2003). Sicker and poorer — the consequences of being uninsured: A review of the research on the relationship between health insurance, medical care use, health, work, and income. Medical-Car Research and Review, 60(2_suppl), 3S–75S.
3 U.S. Census Bureau, 2023 American Community Survey, Five-Year Estimates. Retrieved from http://data.census.gov
4 U.S. Census Bureau, 2023 American Community Survey, Five-Year Estimates. Retrieved from http://data.census.gov
5 U.S. Census Bureau, 2016-2023 American Community Survey, One-Year Estimates. Retrieved from http://data.census.gov
6 Idaho Vital Statistics-Mortality 2018-2022, Idaho Department of Health and Welfare, Division of Public Health, Bureau of Vital Records and Health Statistics, October 2024.
7 “Idaho Proposition 2, Medicaid Expansion Initiative (2018)”. Ballotpedia. Retrieved December 3, 2019.
8 Pfannenstiel, K. (2024, April 1). Idaho removed 185,000 people from Medicaid. over a fifth have re-enrolled. • idahocapital sun. Idaho Capital Sun. https://idahocapitalsun.com/2024/04/01/idaho-removed-185000-people-from-medicaid-over-a-fifth-have-re-enrolled/
9 Pfannenstiel, K. (2024, April 1). Idaho removed 185,000 people from Medicaid. over a fifth have re-enrolled. • idahocapital sun. Idaho Capital Sun. https://idahocapitalsun.com/2024/04/01/idaho-removed-185000-people-from-medicaid-over-a-fifth-have-re-enrolled/
10 National Center for Health Statistics. National Health Interview Survey 2022. Public-use data file and documentation. https://www.cdc.gov/nchs/nhis/documentation/ , 2024.
11 Idaho Department of Health and Welfare, Data provided via public records request November 2024.
12 Idaho Department of Health and Welfare, Data provided via public records request November 2024.
13 CMS, Medicaid & CHIP Monthly Applications, Eligibility Determinations, and Enrollment Reports: 2020-2023, November 2024.
14 Idaho Department of Health and Welfare, Data provided via public records request November 2024.
15 Idaho Department of Health and Welfare, Data provided via public records request November 2024.
16 AAMC. AAMC. 2021 State Physician Workforce Data Report. Washington DC: AAMC, 2021.
17 Dahal A, Skillman SM. Idaho’s Physician Workforce in 2021. Seattle, WA: Center for Health Workforce Studies, University of Washington, July 2022.
18 2022 Idaho Nursing Workforce Report, Idaho Center for Nursing. November 2024.
19 AAMC. AAMC. 2021 State Physician Workforce Data Report. Washington DC: AAMC, 2021.
20 HDPulse: An Ecosystem of Minority Health and Health Disparities Resources. National Institute on Minority Health and Health Disparities. Retrieved from https://hdpulse.minhd.nih.gov