Report Details
 Report Authors
McAllister Hall, Research Associate
Gabe Osterhout, Research Associate
Vanessa Crossgrove Fry, Institute Director
This report was prepared by Idaho Policy Institute at Boise State University and commissioned by Bluum.
Recommended citation:
Hall, M., Osterhout, G., & Crossgrove Fry, V. (2020). Idaho’s Communities of Excellence Charter School Program Cohort 1 Baseline Evaluation 2020. Idaho Policy Institute. Boise, ID: Boise State University.
Download a printable pdf of this report
Executive Summary
In 2018, Idaho’s Communities of Excellence (COE) consortium was awarded a $17.1 million Charter Schools Program (CSP) grant from the U.S. Department of Education. The amount of the award increased to $22.5 million in 2019. Grant funds will be distributed over a five-year period with the intent to achieve Idaho’s COE objectives. One of these objectives is to evaluate and disseminate the successes and lessons of high-quality charter schools to impact the broader education system. Boise State University’s Idaho Policy Institute (IPI) was chosen through a competitive bid process to conduct the evaluation.
IPI’s evaluation of Idaho’s COE program aligns with the consortium’s project goals promised to the U.S. Department of Education. The evaluation is driven by the following core questions:
- How are subgrantee schools using their funds for school-site implementation?
- To what extent are subgrantee schools creating high-quality seats for new students, as measured by school performance?
- How do students and parents perceive the quality of their school vis-a-vis their prior school experience?
- What are school and staff perceptions of the successes, improvements and challenges at subgrantee schools?
These questions were addressed using:
- Financial data received from Bluum (the non-profit organization that serves as a fiscal agent for the grant)
- Standardized test data from the Idaho State Department of Education
- Satisfaction and engagement survey data from the Idaho State Department of Education
- Parent and teacher survey data from the Farkas-Duffett Research (FDR) Group.
This report provides a baseline evaluation of the first cohort of the Communities of Excellence program. 100% ($52,051.00) of this report was funded by Federal CSP Grant dollars; 0% ($0.00) of this event is funded by non-governmental sources; total cost $52,051.00.
Introduction
In 2018, a consortium of leaders in education (Idaho Public Charter School Commission, Idaho State Board of Education and three non-profits, Bluum, the J.A. and Kathryn Albertson Family Foundation and Building Hope) came together to apply for a competitive Charter Schools Program (CSP) grant from the U.S. Department of Education (see Appendix A) to launch, replicate and expand charter schools across the state. As a result, the Idaho’s Communities of Excellence (COE) consortium was awarded a $17.1 million CSP grant. This award was increased to $22.5 million in 2019. Over the grant’s five years, Idaho’s COE program will administer the majority of grant funding (90%) and technical assistance to 20 Idaho public charter schools.
Idaho’s COE program has three main objectives:
- Increase the number of quality charter school seats by 8,200 students, especially for Idaho’s most educationally disadvantaged and rural students, through charter school start up, replication and expansion (described in Appendix A).
- Support the Public Charter School Commission in expanding its quality authorizing efforts while disseminating and supporting best practices for other authorizers statewide.
- Evaluate and widely disseminate the successes and lessons of high-quality charter schools to impact the broader education system.
Idaho Policy Institute (IPI) serves as the independent third-party evaluator to support the program’s third objective. IPI is a non-partisan, interdisciplinary research unit in the School of Public Service at Boise State University. As evaluator, IPI analyzes the COE program design and effectiveness, use of funds and stakeholder perception for each of the CSP charter school subgrantees. Student achievement and growth data, stakeholder engagement data and subgrantee school budgets and expense reports were utilized for analysis. Three reporting periods for each cohort of subgrantees will provide baseline data for each school and cumulative results. IPI’s final report will provide an overall evaluation of Idaho’s COE program and help create an evidence-base of practices and innovations among Idaho’s charter schools.
This report serves as the baseline report for the first cohort of CSP subgrantees and uses data from the 2018/19 school year. The first cohort consists of five charter schools (see Table 1). One of the objectives of the COE project is to ensure educationally disadvantaged and rural students are represented in the subgrantee schools. Table 1 includes demographic data for subgrantee schools, all Idaho schools and all charter schools in Idaho to act as a baseline for measuring future progress toward this goal.
White Pine and Compass Public Charter Schools are more established schools that received grant funds for expansion. White Pine is expanding by adding grades nine through twelve to create two schools under a single charter. The first will be a kindergarten through sixth grade (K-6) school and the second school, White Pine STEM Academy, will have grades seven through twelve. This analysis uses data from their pre-expansion configuration (K-8). Future evaluations will reflect the demographics and scores at White Pine STEM Academy. Compass is planning on expanding by adding seats to their already-established grades eight through ten; data used reflect whole school performance, grades kindergarten through 12 (K-12).
| Compass Charter | Forge International | Future Public | Gem Prep: Meridian | White Pine Charter | Idaho | All Charters | |
|---|---|---|---|---|---|---|---|
| Type | Expansion | Replication | Start Up | Start Up | Expansion | – | – |
| Planned New Seats | 319 | 653 | 576 | 574 | 354 | – | – |
| Urban/Rural* | Suburb: Large | Suburb: Midsize | Suburb: Large | Suburb: Large | Suburb: Small | – | – |
| Year Opened | 2005/06 | 2019/20 | 2018/19 | 2018/19 | 2003/04 | – | – |
| % Hispanic/Latinx | 8.9% | n/a | 15.6% | 9.0% | 10.6% | – | – |
| % Economically Disadvantaged | 15% | n/a | 53% | 48% | 34% | 44.99% | 37.3% |
| % Special Education | 4% | n/a | 12% | 8% | 12% | 10.7% | 9.4% |
| % English Language Learners | 1% | n/a | 17% | <3% | 1% | 6.5% | 2.7% |
| % Non-White/ Non-Hispanic | 7.2% | n/a | 38.1% | 17.3% | 15.9% | 24.9% | 19.6% |
* See Appendix A
Gem Prep: Meridian and Future Public Charter School are start-up schools that were in their first year of operation when awarded the grant. Gem Prep: Meridian began as a K-5 school and plans to grow to serve grades K-12. Future started with grades K-3 and will grow to serve up to grade eight using grant funds.
Forge International School is a replication of Sage International School in Boise. The school opened in the 2019/20 school year serving grades K-6 and will eventually grow to be a K-12 school. Forge will not have any baseline performance data for analysis in this report.
Financial Analysis
Grant funds are awarded to schools that meet the minimum acceptable score during a competitive third-party review process. Subgrant amounts are based on whether the school is a start-up, replication or expansion. Each school has an approved budget and timeline with Bluum regarding spending. All school expenditures within their budget must align with an “allowable cost guide” provided by Bluum. Most schools plan to spread their funding across two years. All spending data is managed by and was received from Bluum (see Table 2).
In October 2019, subgrantee funding for White Pine was frozen by Bluum after failing risk management assessments. Funding resumed in May 2020 after the school’s governing board and administrative team completed the necessary financial training required by Bluum. This funding freeze will be reflected in future reports.
Future and Gem Prep: Meridian each were in their first year of operation when receiving funds. As a result, their first-year spending may be low compared to start up schools in future reports.
Table 2: Spending and Distribution of Cohort 1 Grant Funds
| Compass Charter | Forge International | Future Public | Gem Prep: Meridian | White Pine Charter | Cohort | |
|---|---|---|---|---|---|---|
| Type | Expansion | Replication | Start Up | Start Up | Expansion | – |
| Grant Amount | $800,000 | $1,250,000 | $1,250,000 | $1,250,000 | $800,000 | $5,350,000 |
| Planned New Seats | 319 | 653 | 576 | 574 | 354 | 2476 |
| Baseline Expenditures | – | – | – | – | – | – |
| Spending | $484,491 | $436,970 | $8,654 | $77,952 | $50,591 | $1,058,659 |
| Percent Spent | 60.6% | 35.0% | 0.7% | 6.2% | 6.3% | 19.8% |
| New Seats | 85 | 258 | 297 | 379 | 68 | 1087 |
| Spending per Seat | $686.70 | $2,857.26 | $745.39 | $882.17 | $295.55 | $841.14 |
| Remaining Grant Funds* | – | – | – | – | – | – |
| Funding Left | $315,509 | $813,030 | $1,241,346 | $1,172,048 | $749,409 | $4,291,341 |
| Seats to Goal | 234 | 395 | 279 | 195 | 286 | 1389 |
| Budget End Date | 11/30/2019 | 6/30/2021 | 7/31/2021 | 4/30/2021 | 6/30/2021 | – |
*Spending by schools from the time of award, 5/10/2019, through 9/30/2019
Baseline spending as a whole was greater at Compass and Forge International. Each of these schools moved into new buildings in the 2019/20 school year. A breakdown of their spending (See Table 3) shows that 52% of total baseline spending for Compass and 27% for Forge International was dedicated to purchasing furniture and fixtures. This pattern of larger proportions of the budget being spent in the first year, especially toward furniture and fixtures, when schools are building or moving into new facilities will likely be seen in future cohorts.
Table 3 provides data regarding specific expenditures for each of the schools.
Table 3: School Expenditures of Cohort 1 Grant Funds
| Compass Charter | Forge International | Future Public | Gem Prep: Meridian | White Pine Charter | All Charters | |
|---|---|---|---|---|---|---|
| Staffing | $8,334 | $75,688 | $0 | $0 | $8,328 | $92,350 |
| Professional Development | $18,303 | $0 | $75,300 | $0 | $2,150 | $28,178 |
| Curriculum | $27,809 | $63,087 | $0 | $75,300 | $0 | $166,197 |
| Purchased Services | $0 | $4,200 | $0 | $0 | $0 | $4,200 |
| Furniture and Fixtures | $252,069 | $117,972 | $0 | $0 | $0 | $370,041 |
| Technology | $177,977 | $148,646 | $929 | $0 | $40,113 | $367,665 |
| Software Licenses | $0 | $27,376 | $0 | $2,652 | $0 | $30,028 |
| Total | $484,491 | $436,970 | $8,654 | $77,952 | $50,591 | $1,058,659 |
| Percent Spent | 60.6% | 35.0% | 0.7% | 6.2% | 6.3% | 19.8% |
*Expenditures through 9/30/2019
Aside from ameliorating costs of moving into a new facility, the majority of subgrantee schools dedicated baseline grant funds toward technology. Technology spending by four of the five schools accounted for 35% of total cohort baseline spending. Funds for new technology are less likely to be prioritized in general school budgets compared to the other approved expenditures found in Table 3. As a result, this greater amount of spending toward technology may be a pattern seen in future reports.
Gem Prep: Meridian is an exception to this potential pattern. Gem Prep schools, by design, focus on technological learning so their general budget may prioritize technological spending more than the other subgrantee schools. Future reports may include other schools with a similar emphasis that may also not dedicate large portions of grant funds toward technology.
School Performance Analysis
Idaho’s COE program defines a high-quality charter school as a school that has both above average student achievement and student growth scores on Idaho’s state assessments in English Language Arts (ELA) and mathematics.
A school must be high-quality to qualify for grant funds. This analysis utilizes Idaho Standard Achievement Test (ISAT) scores measuring achievement and growth. Scores for CSP schools are reported individually and in the aggregate. Scores for all public schools in the state as well as all public charter schools are provided for comparison.
Four of the five schools selected to be in the first cohort receiving CSP funds from Bluum were in operation in the 2018-19 school year and consequently have performance data. Reported ISAT scores were received from the Idaho State Department of Education and will act as a baseline for comparison in future reports. This baseline reflects the performance of these schools before having the benefit of receiving CSP funds.
Table 4 shows the percent of total students that scored proficient or higher on the Math and ELA sections of the ISAT. Future reports will only report the scores of fourth and eighth grade students to create a representative sample of school performance. In the 2018/19 school year, only two schools in the CSP cohort served eighth grade students and only three served fourth grade students. Demographic scores broken down by grade level would not be representative of the cohort population. As a result, the scores of all fourth and eighth grade students are included in the table, but the demographic breakdowns represent all students who completed the ISAT in the 2018/19 school year.
Overall, the performance of the CSP cohort is above average compared to all students in the state of Idaho. Some of this discrepancy could be explained by the difference in the demographic make-up of these groups. Economically disadvantaged students represent 44.9% of all Idaho students and only 28% of the students in the cohort schools. Hispanic students represent 18.3% of Idaho students and only 10% of cohort students. These discrepancies are expected to change as schools grow.
As noted, the data collected represents school performance before receiving CSP funds. Many of these schools as a whole were already meeting or exceeding the state goal targets but not all subgroups within individual schools are reaching the benchmark. Future comparisons should focus on the improvement of these groups as well as the school as a whole.
Table 4: Percent Students Meeting or Exceeding State Academic Achievement Targets
| 2018/19 ISAT Performance | Compass Charter | Future Public | Gem Prep: Meridian | White Pine Charter | Cohort* | State Goal | Idaho | All Charters |
|---|---|---|---|---|---|---|---|---|
| Math | – | – | – | – | – | – | – | – |
| All Students | 76.2% | 36% | 62.6% | 55.6% | 67.3% | 51.3% | 45.1% | 52.0% |
| 4th Grade Students | 82.7% | n/a | 72% | 69.4% | 77.3% | 51.3% | 50.6% | 57.4% |
| 8th Grade Students | 61.3% | n/a | n/a | 58.8% | 60.6% | 51.3% | 41.5% | 47.7% |
| Economically Disadvantaged | 62.9% | 24.1% | 64.7% | 47.2% | 53.6% | 41.9% | 32.8% | 40.8% |
| Students with Disabilities | 23.8% | *** | *** | 15.8% | 16.3% | 29.3% | 12.8% | 16.1% |
| Hispanic/Latinx | 73.7% | *** | *** | 27.9% | 48.7% | 35.0% | 25.9% | 32.5% |
| English Language Learners | *** | *** | *** | *** | 23.8% | 22.6% | 15.7% | 19.1% |
| English Language Arts | – | – | – | – | – | – | – | – |
| All Students | 84.1% | 32% | 64.3% | 60.4% | 73.1% | 60.8% | 55.6% | 63.6% |
| 4th Grade Students | 83.7% | n/a | 64% | 63.3% | 75.0% | 60.8% | 52.4% | 58.2% |
| 8th Grade Students | 84.9% | n/a | n/a | 65.7% | 79.7% | 60.8% | 54.4% | 65.3% |
| Economically Disadvantaged | 77.1% | 20.7% | 70.6% | 44% | 58.2% | 50.5% | 42.7% | 54.2% |
| Students with Disabilities | 23.8% | *** | *** | 13.2% | 13.8% | 29.2% | 14.2% | 20.2% |
| Hispanic/Latinx | 82.5% | *** | *** | 41.9% | 58% | 44.7% | 36.9% | 46.3% |
| English Language Learners | *** | *** | *** | *** | 28.6% | 22.4% | 18.9% | 24.6% |
*Forge International is not included because it was not in operation in the 2018/19 school year
***FERPA protected data (see Appendix A)
Students with disabilities in each group are not reaching the goals set by the state. There has been debate among multiple stakeholders across the state of whether the goal set for students with disabilities is reasonable. Growth may be a better standard for measuring performance of this subgroup.
Growth targets, or increases in achievement, are also set by the state (See Appendix A) and measure if students are making adequate progress from year to year toward proficiency rather than actually reaching proficiency. The percentage of students meeting or exceeding state growth targets is shown in Table 5.
Grade three is the first year that students complete the ISAT. In the 2018/19 school year, Future Public School only served K-3 students. Therefore, there are no corresponding growth scores to report.
Table 5: Percent Students Meeting or Exceeding State Academic Growth Targets
| 2018/19 ISAT Performance | Compass Charter | Future Public | Gem Prep Meridian | White Pine Charter | Cohort* | Idaho | All Charters |
|---|---|---|---|---|---|---|---|
| Math | – | – | – | – | – | – | – |
| All Students | 79.9% | n/a | 74.3% | 65.6% | 75.1% | 54.2% | 60.8% |
| 4th Grade Students | 79.3% | n/a | >70% | 89.6% | 83.9% | 58.6% | 66.3% |
| 8th Grade Students | 64.8% | n/a | n/a | 71.0% | 66.4% | 49.7% | 54.1% |
| Economically Disadvantaged | 70.4% | n/a | 76.7% | 61.5% | 67.6% | 44.9% | 52.1% |
| Students with Disabilities | *** | n/a | *** | 25.0% | 29.5% | 24.5% | 27.8% |
| Hispanic/Latinx | 76.1% | n/a | *** | 56.7% | 67.9% | 39.9% | 46.1% |
| English Language Learners | *** | n/a | *** | *** | *** | 31.4% | 31.7% |
| English Language Arts | – | – | – | – | – | – | – |
| All Students | 86.6% | n/a | 71.4% | 73.9% | 81.4% | 65.4% | 71.2% |
| 4th Grade Students | >72% | n/a | >70% | 70.8% | 74.8% | 60.4% | 62.9% |
| 8th Grade Students | 93.4% | n/a | n/a | >75% | 90.2% | 66.2% | 76.7% |
| Economically Disadvantaged | 81.7% | n/a | 73.3% | 60.3% | 70.9% | 57.1% | 64.8% |
| Students with Disabilities | 66.7% | n/a | *** | 33.3% | 44.4% | 34.3% | 41.8% |
| Hispanic/Latinx | 76.1% | n/a | *** | 66.7% | 70.4% | 53.6% | 59.1% |
| English Language Learners | *** | n/a | *** | *** | *** | 42.0% | 43.0% |
* Forge International is not included because it was not in operation in the 2018/19 school year
***FERPA protected data (see Appendix A)
The schools in the cohort and their corresponding subgroups perform better than students on average across the state. A goal of the CSP grant is to improve the growth scores at grant awarded schools and see an improvement in overall state growth scores as a result. Future evaluations will use this data for comparison.
Quality Perception Analysis
The 2018/2019 Idaho Engagement and Satisfaction Survey (ESS) and parent and teacher surveys (conducted by The FDR Group) provide insight into the perceptions of school quality among parents, students and school employees. Data from the CSP schools was compared with ESS data from all of Idaho.
The ESS annually measures student, parent, and staff engagement in schools across the state. The 2019 survey was conducted between April 15 and May 17. Specifically, the survey captures overall student engagement, as well as students’ cognitive (level of investment), social (level of effort) and emotional (feeling about school) engagement.
Engagement levels are also measured by select student groups, such as Hispanic or Latinx, economically disadvantaged and students with disabilities. Parent and staff engagement and satisfaction are reported at the aggregate level.
Survey data are reported for four of five schools in the first cohort receiving CSP funds. As detailed in Table 6, the first cohort average scored higher than the Idaho average in student overall, cognitive, social and emotional engagement. In fact, each CSP school scored higher than other Idaho schools on overall, cognitive and emotional engagement.
Table 6: Idaho Engagement and Satisfaction Survey Results
| Compass Charter | Future Public | Gem Prep: Meridian | White Pine Charter | Cohort* | Idaho | |
|---|---|---|---|---|---|---|
| Student Engagement | – | – | – | – | – | – |
| Overall | 58.7% | 69.0% | 66.1% | 58.5% | 63.1% | 52.6% |
| Cognitive | 52.0% | 65.1% | 60.2% | 60.9% | 59.6% | 51.3% |
| Social | 65.8% | 69.8% | 70.7% | 49.1% | 63.9% | 53.5% |
| Emotional | 58.3% | 72.1% | 67.5% | 65.7% | 65.9% | 52.9% |
| Hispanic/Latinx | 55.9% | *** | *** | 54.4% | ^ | 50.4% |
| Economically Disadvantaged | 49.6% | *** | 66.7% | 56.3% | ^ | 52.0% |
| Students with Disabilities | 53.6% | *** | *** | 52.6% | ^ | 50.4% |
| Parent and Staff Engagement | – | – | – | – | – | – |
| Parent | 82.9% | 90.4% | 84.0% | 83.7% | 85.3% | 74.5% |
| Staff | 82.0% | 84.2% | 73.7% | 72.1% | 78.0% | 75.7% |
* Forge International is not included because it was not in operation in the 2018/19 school year
***FERPA protected data (see Appendix A)
^ Incalculable due to FERPA protected data
The FDR Group conducted focus group interviews in October 2019. The data from these focus groups were used to create parent and teacher surveys that were distributed in February and March 2020. Parents and teachers from all of the operating subgrantee schools in the first two cohorts were included in the survey. Reported here are the results broken out for Cohort 1 schools.
Parent Perceptions
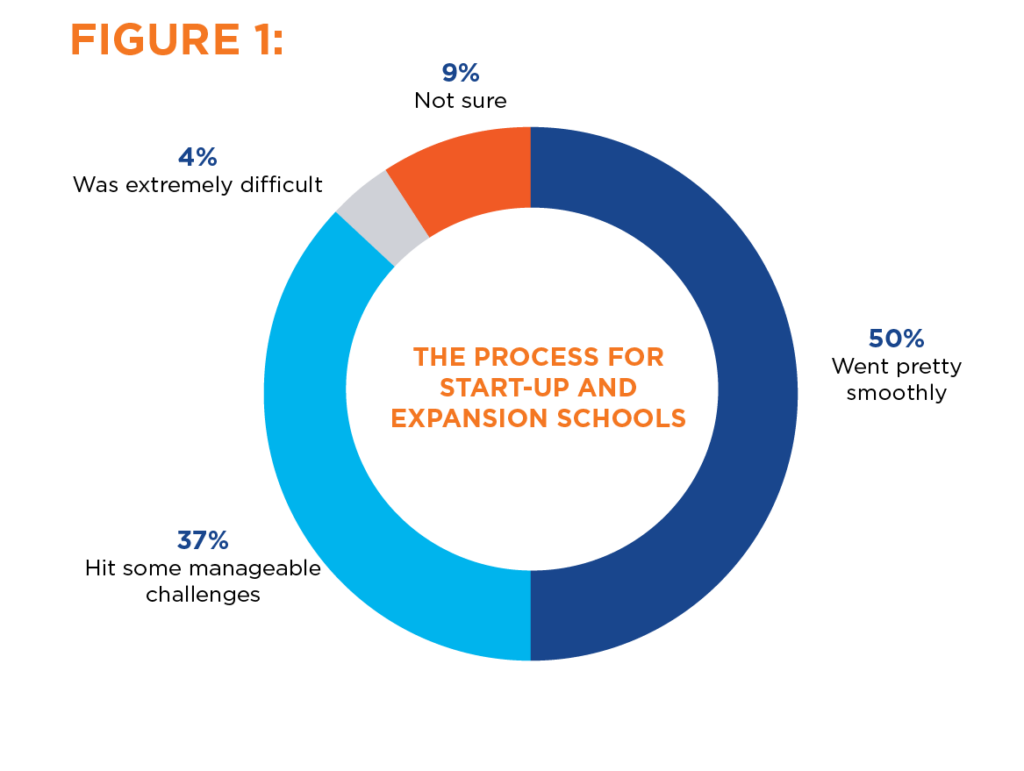
The first survey captured the perceptions of 761 parents’ experiences with their schools, including whether they are satisfied, how much their child is learning and why they chose that particular school, among other perceptual feedback.
Overall, parents largely report positive perceptions of their child’s charter school. Parents at start-up and expansion schools overwhelmingly think the process went smoothly or faced manageable challenges (see Figure 1).
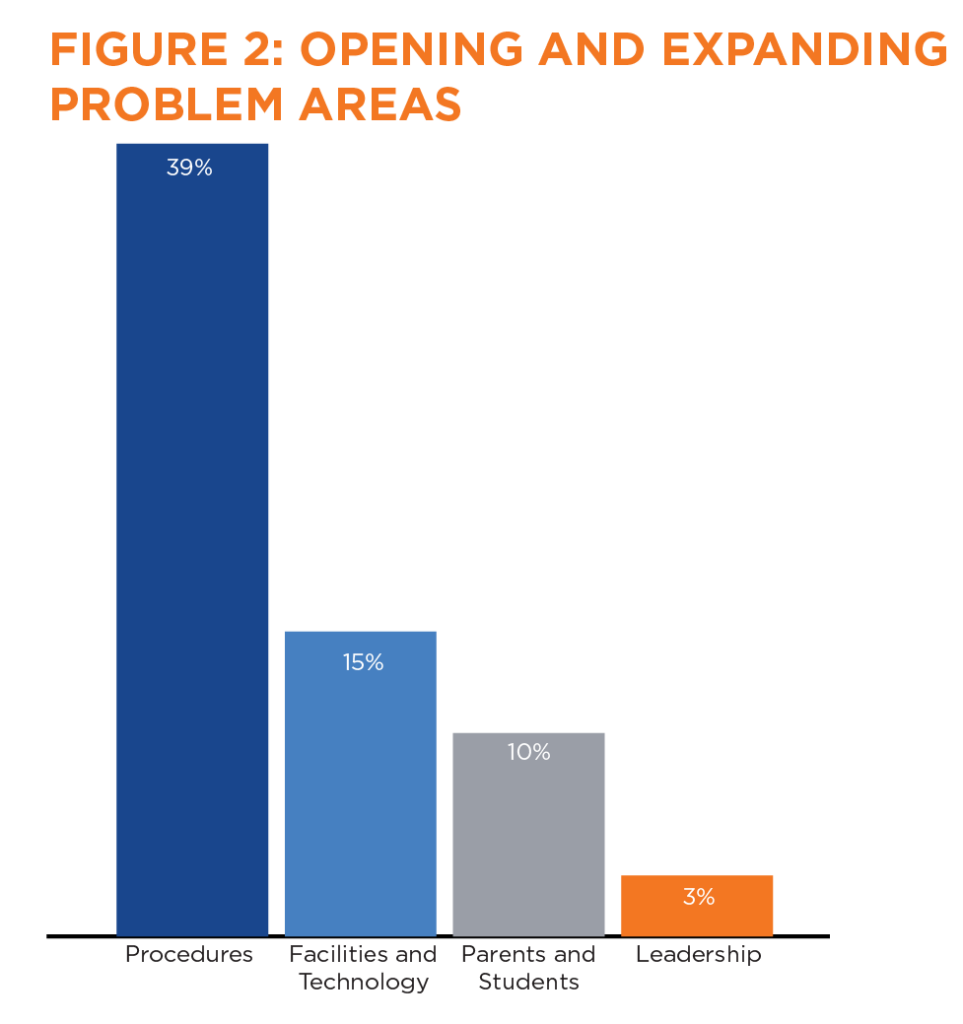
The most common problem areas for these schools are procedural issues such as scheduling or parking (see Figure 2).
A significant majority of parents report that they are satisfied with their child’s school, would recommend it to another family, believe their child is learning a lot and their child will likely remain at the school next year (see Table 7).
In terms of expectations, most parents consider teacher quality, parent communication, safe atmosphere and personalized instruction as essential features of a school, and parents largely report that their child’s school is either excellent or good in each of these areas (see Table 8).
The most popular reason for parents to apply to a school is that its academic program or instructional approach appealed to them (see Table 9).
Table 7: Levels of Satisfaction
| Very satisfied with school | 65% |
|---|---|
| Child is happy day-to-day when going to school | 64% |
| Would definitely recommend to family seeking a top-notch school | 78% |
| Strongly agree child is learning a lot at this school | 64% |
| Child will definitely stay here next year | 72% |
Table 8: Meeting Expectations
| – | Considered Essential | School is Excellent or Good |
|---|---|---|
| Top-notch teachers who love working with kids | 93% | 90% |
| Communication with parents | 84% | 80% |
| Safe and orderly school atmosphere | 74% | 93% |
| Personalized Instruction | 57% | 74% |
Table 9: Motivation for School Application
| – | Very Important |
|---|---|
| Academic program or instructional approach appealed to me | 80% |
| Heard great things from other people | 45% |
| The traditional public school was a poor fit for my child | 42% |
| Impressed by school’s leadership | 35% |
| Impressed by school’s teachers | 27% |
| School was close or convenient | 25% |
| Had a good feeling as soon as I walked in door | 23% |
| The building looked terrific | 9% |
Teacher Perceptions
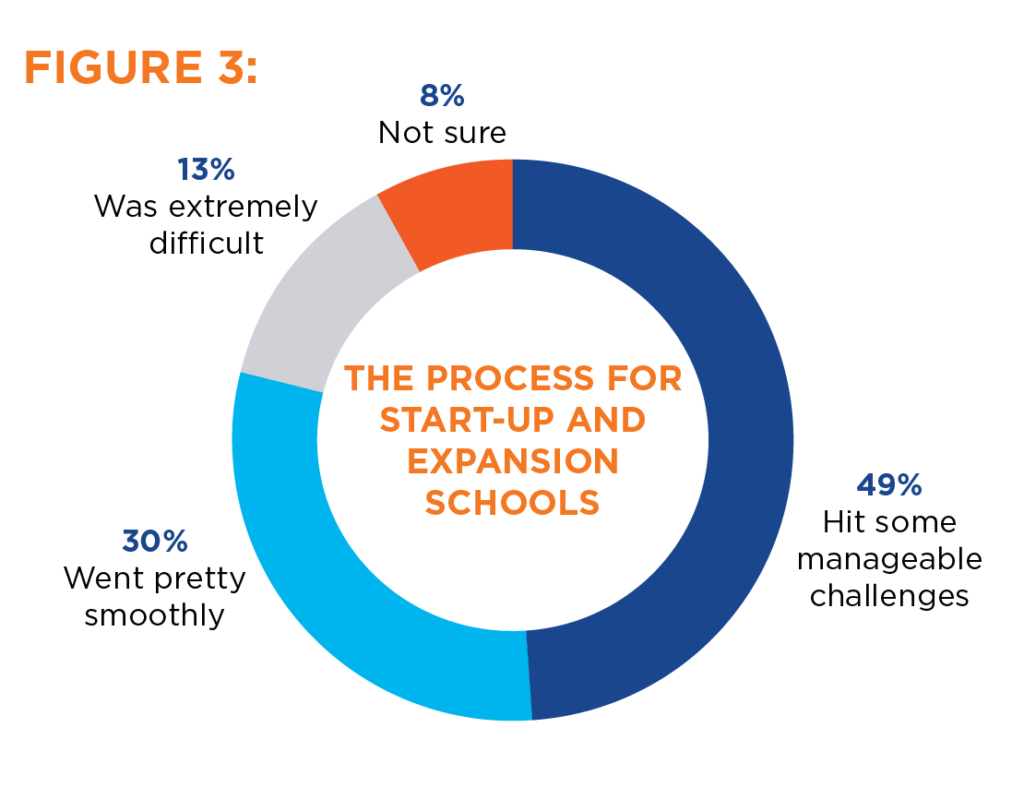
On-the-ground assessment of the CSP schools was achieved by surveying 92 teachers across the first cohort of subgrantee charter schools. Teachers offered insight on the start-up and expansion process, problem areas, job satisfaction, and their perceptions of parents and students, among other areas of feedback.
Similar to parents, most teachers perceive the start-up and expansion process as a smooth or manageable experience (see Figure 3).
Teachers, however, believe the main problem areas during their school’s opening or expansion were parents and students struggling to adjust, as well as facilities and technology (see Figure 4).
An overwhelming majority of teachers perceive student learning and high standards as fundamental to their school’s focus (see Figure 5).
Most teachers consider their school excellent in focusing on academic achievement, having a staff that works as a team, building a culture of respect and communication by leadership (see Table 10). However, teachers report lower satisfaction with the amount of extracurricular options available.
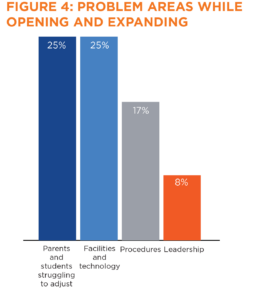
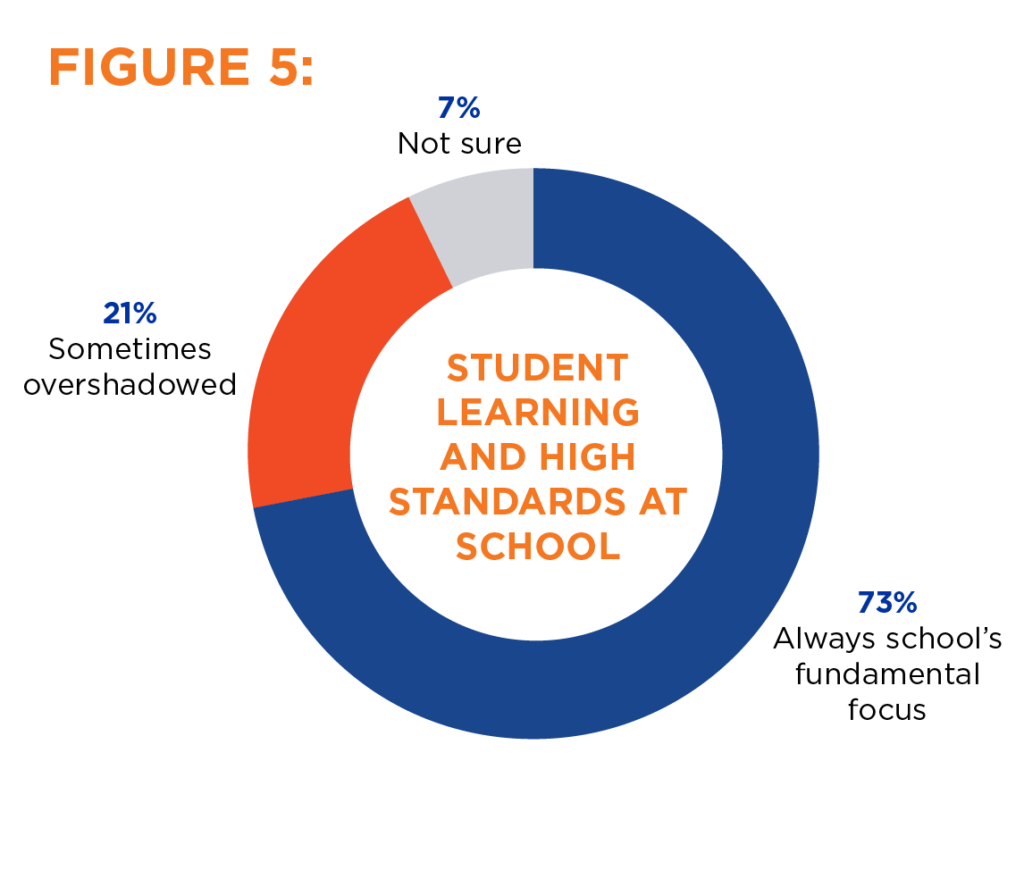
Table 10: Teacher Perceptions Across Metrics
| – | Excellent | Good | Fair | Poor |
|---|---|---|---|---|
| Focusing on academic achievement, learning | 60% | 33% | 7% | 1% |
| Staff works as a team, with shared vision | 52% | 35% | 10% | 3% |
| Culture of respect, good behavior in building | 52% | 33% | 11% | 4% |
| Leadership communication and trust with staff | 46% | 31% | 16% | 7% |
| Being open to new ideas and innovation | 43% | 42% | 14% | 2% |
| Commitment to education struggling students | 44% | 40% | 10% | 3% |
| Solving building problems promptly | 38% | 45% | 13% | 3% |
| Commitment to special needs students | 39% | 37% | 19% | 3% |
| Involving parents in school success | 37% | 46% | 11% | 3% |
| Achieving student diversity | 34% | 39% | 19% | 4% |
| Providing enough extra-curricular options | 10% | 33% | 35% | 18% |
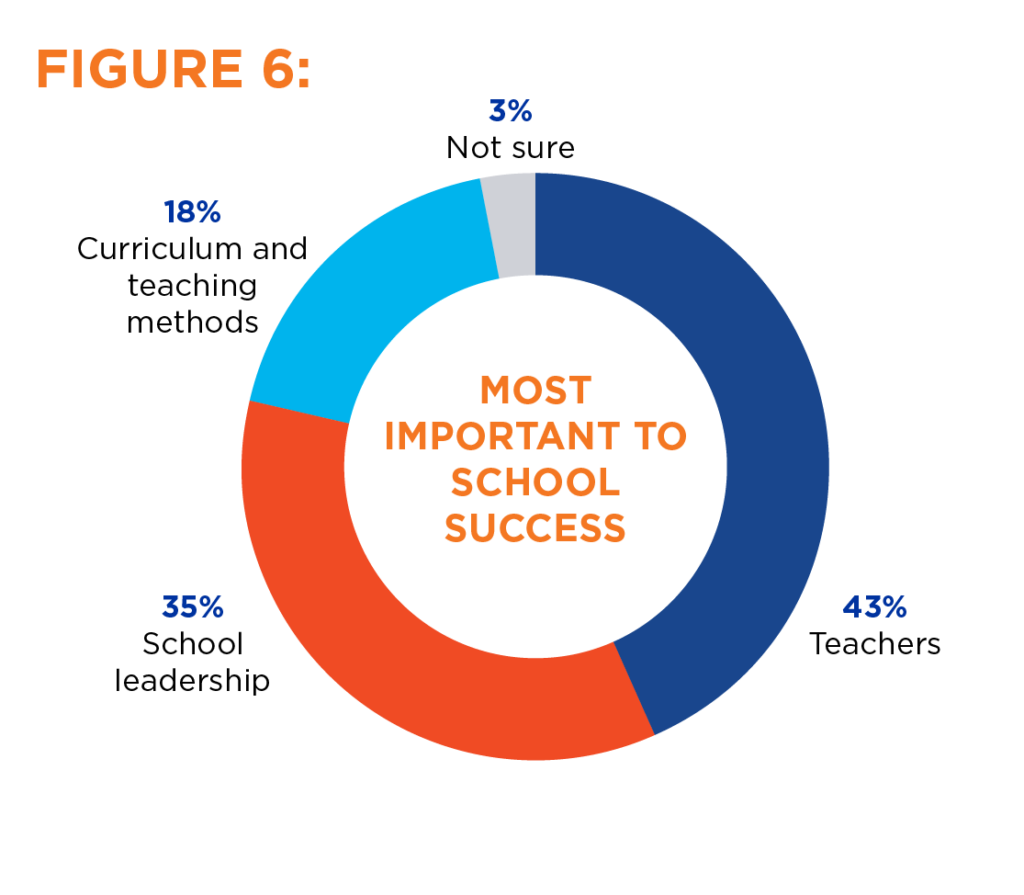
Teachers consider their role and school leadership to be the most important factors to school success (see Figure 6).
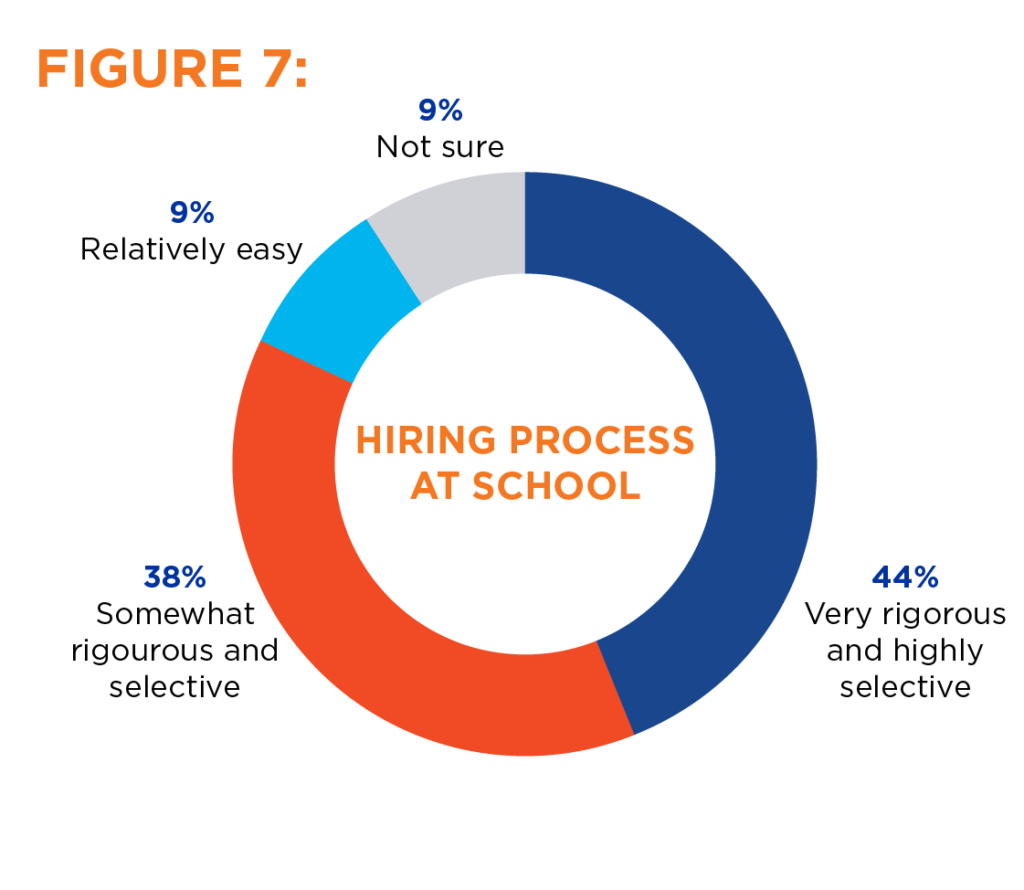
In terms of the selection process, nearly half of all teachers perceive hiring at their school as very rigorous and highly selective, while fewer than 1 in 10 see the hiring process as relatively easy (see Figure 7).
A majority of teachers are satisfied in their role at their current school, while 3 in 4 would stay at their current charter school if given the option to work anywhere (see Table 11).
Table 11: Levels of Satisfaction
| Very satisfied as a teacher in this school | 64% |
|---|---|
| If I could work anywhere (private, regular) I would stay in my current charter school | 75% |
| Compared to the regular public schools, I feel a greater sense of professional satisfaction here | 43% |
Table 12: Administrative Support
| Percent of teachers who agree with the following statements | |
|---|---|
| I feel part of a team of quality professionals working toward a shared vision | 95% |
| I have a strong sense of accomplishment-I’m making a difference | 93% |
| My administrator is easy to approach with problems and suggestions | 92% |
| The administration genuinely values me and my colleagues | 92% |
| I have the resources to do my job effectively | 87% |
| I’m given professional autonomy and initiative | 83% |
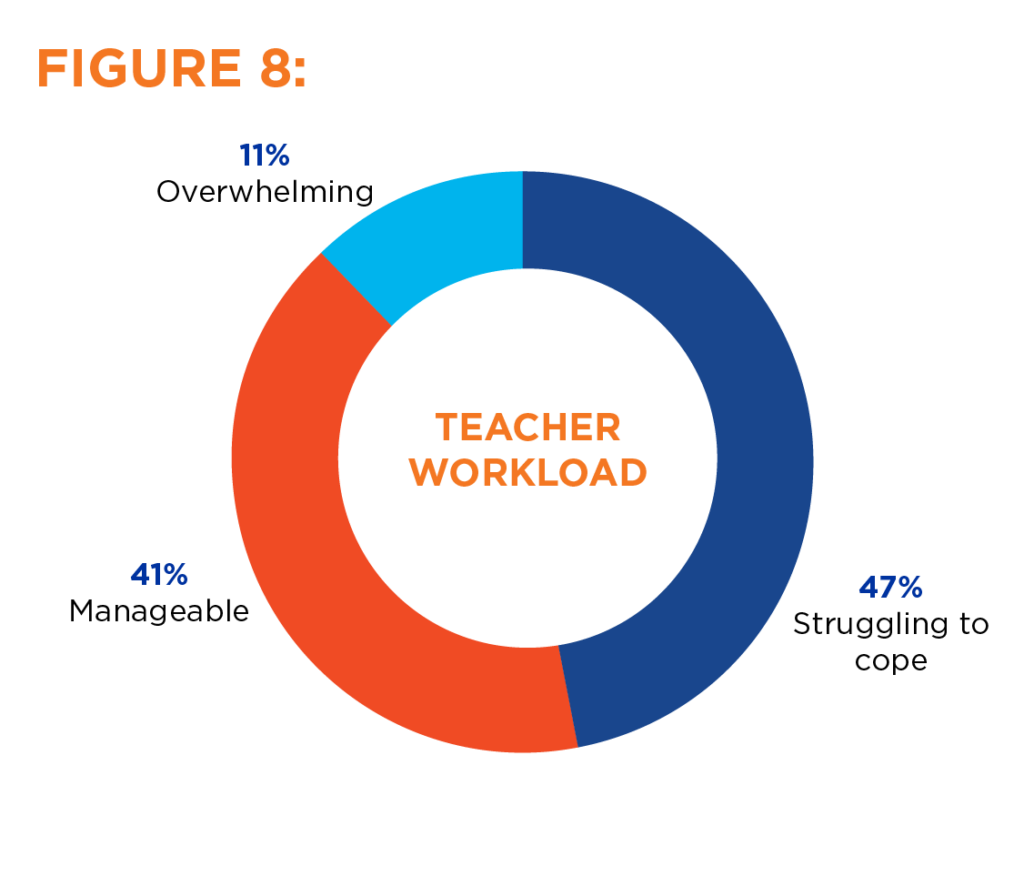
Teachers widely perceive that they have strong support from their school’s administration (see Table 12). However, teachers also feel that they face a heavy workload (see Figure 8). Nearly half of all teachers claim that they are struggling to cope with the workload while 4 in 10 find it manageable.
Nearly half of teachers strongly agree that most parents trust their school and that most students are excited to be there (see Table 13). A similar proportion, however, agree that too many parents registered their students without understanding the school’s purpose or are confused by the school’s teaching approach and methods. This seems to contradict the perception of parents, previously mentioned, that instructional approach was the most important factor in choosing their child’s school.
Table 13: Teacher Perceptions Across Metrics
| Agree Strongly | Agree Somewhat | Disagree Somewhat | Disagree Strongly | |
|---|---|---|---|---|
| Most parents trust our school | 45% | 44% | 9% | 1% |
| Most students are excited to be here | 40% | 54% | 2% | 2% |
| We are a school of choice so parents and students are more likely to appreciate it | 24% | 49% | 23% | 2% |
| Too many parents signed up without understanding what our school is about | 15% | 36% | 24% | 20% |
| Too many parents are confused by teachers approach and methods | 8% | 43% | 26% | 20% |
Conclusion
This baseline evaluation of Cohort 1 of the Communities of Excellence Program indicates that the selected CSP schools were outperforming traditional public schools prior to receiving CSP funding. Baseline spending indicates that schools moving into new facilities use a majority of grant funds quickly and that most subgrantee schools use grant funds for technology. The impacts of these expenditures at the schools will be measured in future reports. Finally, stakeholder perceptions of the schools are more positive than those of traditional public schools.
Appendix
CSP: Charter School Program – Authorized by title V, part B, subpart 1 of the Every Student Succeeds Act (ESSA, Public Law 114-95), which reauthorized the Elementary and Secondary Education Act of 1965 (ESEA), the federal Charter School Program (CSP) provides funding to State Entities with the purpose “to expand opportunities for all students, particularly traditionally underserved students, to attend public charter schools and meet challenging State academic standards; provide financial assistance for the planning, program design, and initial implementation of charter schools; increase the number of high-quality charter schools available to students across the United States; evaluate the impact of charter schools on student achievement, families, and communities; share best practices between charter schools and other public schools; encourage States to provide facilities support to charter schools; and support efforts to strengthen the charter school authorizing process.”
Types of Schools:
Expansion: A school that intends to significantly increase enrollment or add one or more grades
Replication: An existing school opens a new charter school or a new campus of the school based on their existing educational model can either be under and existing charter or an additional charter
Start Up: A school that did not previously exist. The must have opened within the past year or is approved by an authorizer to open in the coming Fall
Urban/Rural: Designations are from the National Center for Education Statistics which are based from population density estimates from the US Census Bureau:
City – Large: Territory inside an Urbanized Area and inside a Principal City with population of 250,000 or more.
City – Midsize: Territory inside an Urbanized Area and inside a Principal City with population less than 250,000 and greater than or equal to 100,000.
City – Small: Territory inside an Urbanized Area and inside a Principal City with population less than 100,000.
Suburban – Large: Territory outside a Principal City and inside an Urbanized Area with population of 250,000 or more.
Suburban – Midsize: Territory outside a Principal City and inside an Urbanized Area with population less than 250,000 and greater than or equal to 100,000.
Suburban – Small: Territory outside a Principal City and inside an Urbanized Area with population less than 100,000.
Town – Fringe: Territory inside an Urban Cluster that is less than or equal to 10 miles from an Urbanized Area.
Town – Distant: Territory inside an Urban Cluster that is more than 10 miles and less than or equal to 35 miles from an Urbanized Area.
Town – Remote: Territory inside an Urban Cluster that is more than 35 miles from an Urbanized Area.
Rural – Fringe: Census-defined rural territory that is less than or equal to 5 miles from an Urbanized Area, as well as rural territory that is less than or equal to 2.5 miles from an Urban Cluster.
Rural – Distant: Census-defined rural territory that is more than 5 miles but less than or equal to 25 miles from an Urbanized Area, as well as rural territory that is more than 2.5 miles but less than or equal to 10 miles from an Urban Cluster.
Rural – Remote: Census-defined rural territory that is more than 25 miles from an Urbanized Area and also more than 10 miles from an Urban Cluster.
https://nces.ed.gov/programs/edge/docs/LOCALE_CLASSIFICATIONS.pdf
FERPA: Family Educational Rights and Privacy Act – FERPA is a Federal law designed to protect the privacy of students and families by ensuring that those who access publicly available data are not able to identify individual students. The Idaho State Board of Education’s Data Management Council’s implementing Policies and Procedures of FERPA (Idaho Statute Title 33-133) requires the redaction of:
- Data representing less than 5 students
- Where the difference between the total of one or more cells of categorical data is less the 5 of the total student population
- The combination of the data requested, and other data already made publicly available would result student identification (this is known as the two-document rule)
Idaho Academic Growth Targets: A student’s score on the ISAT is reported in one of four achievement levels (from Below Basic to Advanced). Each of these performance levels is associated with a score scale specific to each grade.
To calculate a student’s academic growth target, a student’s scale score from the prior year will serve as a baseline. Next, the score that the student needs to reach Level 3 (Proficient) on the statewide assessment: three years in the future is identified and called a target scale score. A simple subtraction of the target scale score and the baseline score results in the necessary growth needed to meet proficiency in three years. This number is then divided by three, providing an annual growth target.
The change between a student’s scale score from year to year is compared to their annual growth target. If the student’s actual growth was greater than or equal to the annual growth target, the student is “on track.”