Number of Incidents by User Classification Metric for October 2024 through March 2025
About This Metric
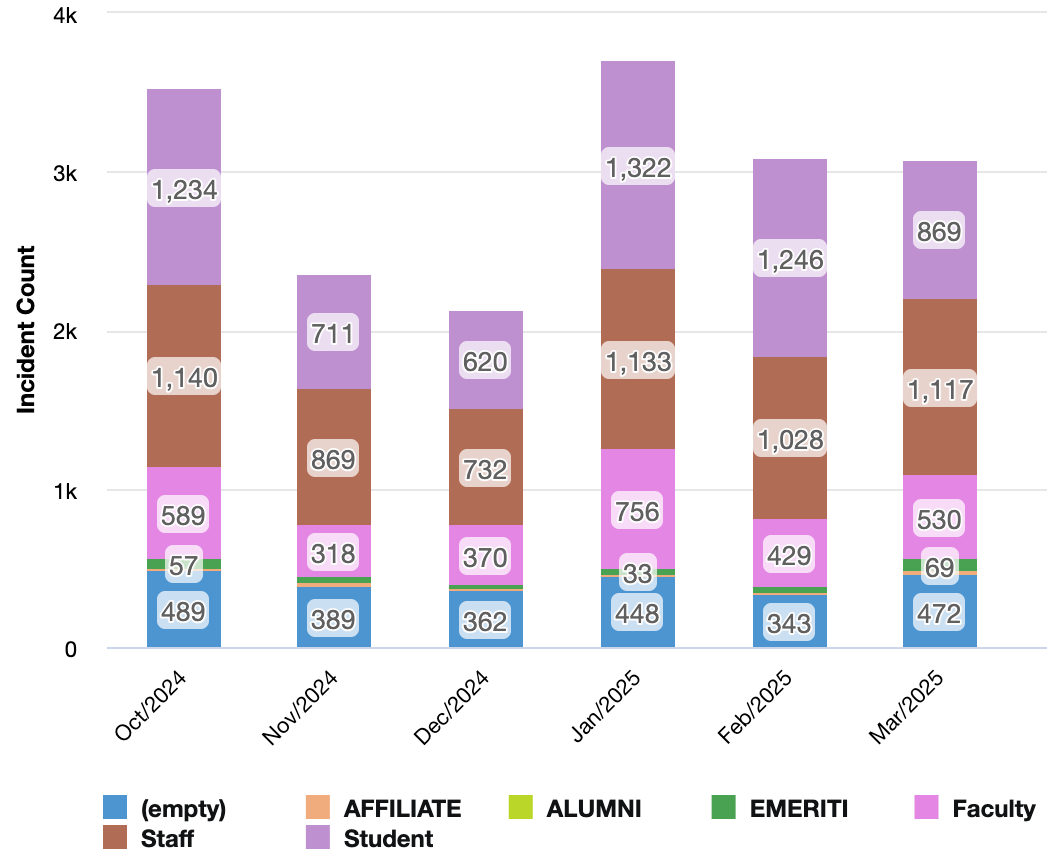
This metric measures incidents per month as reported by different campus community audiences including students, staff, and faculty.
October 2024
- Student incidents: 1,234
- Staff incidents: 1,140
- Faculty incidents: 589
- Other: 546
November 2024
- Student incidents: 711
- Staff incidents: 869
- Faculty incidents: 318
- Other: 389
December 2024
- Student incidents: 620
- Staff incidents: 732
- Faculty incidents: 370
- Other: 362
January 2025
- Student incidents: 1,322
- Staff incidents: 1,133
- Faculty incidents: 756
- Other: 481
February 2025
- Student incidents: 1,246
- Staff incidents: 1,028
- Faculty incidents: 429
- Other: 343
March 2025
- Student incidents: 869
- Staff incidents: 1,117
- Faculty incidents: 530
- Other: 541