
You Are What You Eat – Science & Engineering Festival Results

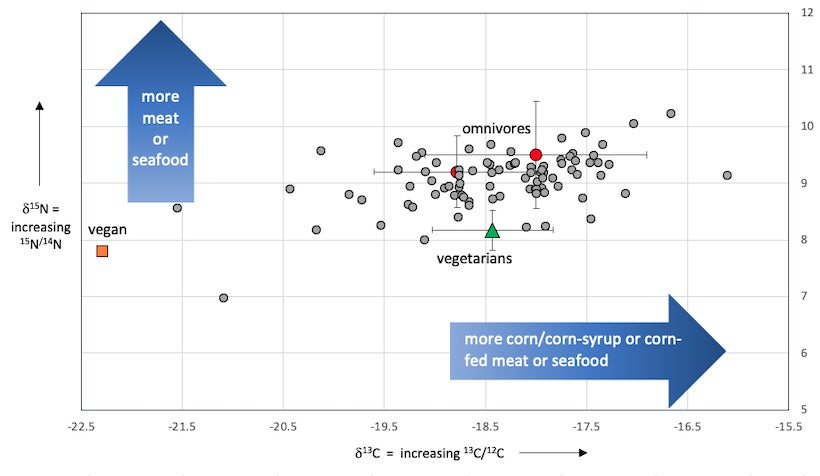
Individual results are found in the table. Look up your sample number in the table and read across for the carbon (δ13C) and nitrogen (δ15N) isotope results. All the data collected are shown together on the plot below (scroll down!).  The results show that most of the visitors have an omnivorous diet, with a few to the left of the plot showing a more vegetarian (lower meat/dairy) diet.

Please email lindareynard@boisestate.edu with any questions, or if you’d like help finding your data point on the plot. Thank you for participitating and I hope you found it interesting!
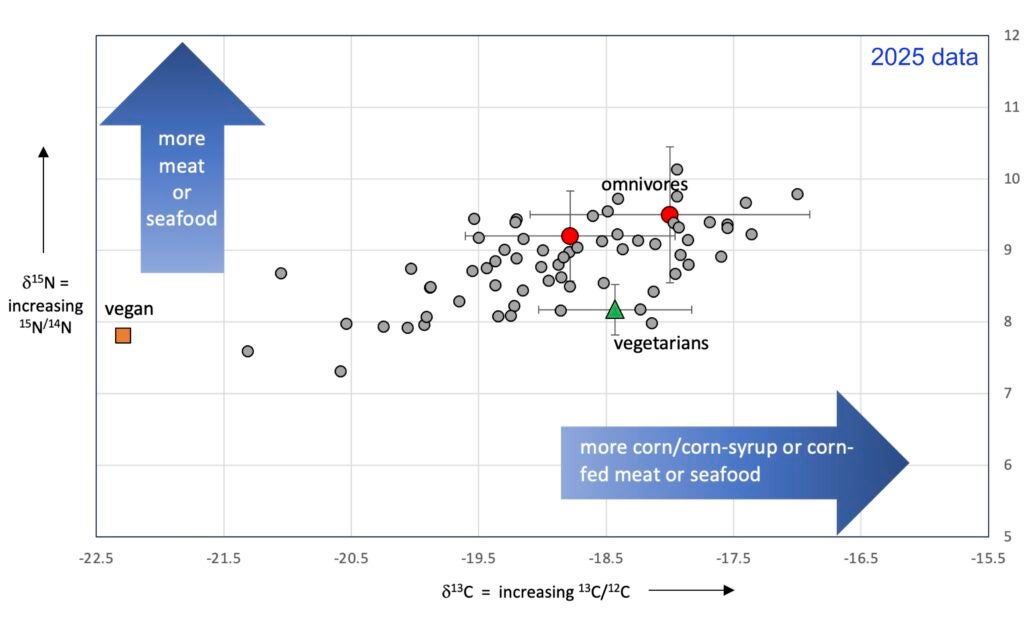
Sample numberCarbon isotopes
13C)
Nitrogen isotopes
15N)
100-18.59.5
101-19.98.5
102-18.89.0
103-21.08.7
104-18.18.4
105-19.08.6
106-18.88.5
107-17.99.7
108-19.59.4
109-18.69.5
110-18.98.8
111-19.48.8
112-19.58.7
113-18.19.1
114-17.68.9
115-19.29.4
116-19.59.2
117-19.98.5
118-18.59.1
119-18.49.7
120-18.18.0
121-18.08.7
122-18.88.9
123-18.29.1
124-19.39.0
125-17.910.1
126-17.98.8
127-17.49.7
128-19.48.5
129-17.59.4
130-19.09.0
131-17.98.9
132-17.79.4
133-18.58.5
134-18.28.2
135-19.29.4
136-19.98.0
137-19.28.4
138-18.88.6
139-19.28.2
140-18.49.0
141-19.28.1
142-20.17.9
143-19.38.1
144-19.98.1
145-20.67.3
146-19.28.9
147-21.37.6
148-20.58.0
149-18.09.4
150-18.49.2
151-20.27.9
152-17.59.3
153-17.99.1
154-19.78.3
155-19.19.2
156-17.09.8
157-18.98.2
158-19.08.8
159-20.08.7
160-17.99.3
161-17.49.2
162-19.48.7
163-18.79.0

Visitor Data

Grey dots show 2025 BSU visitor data

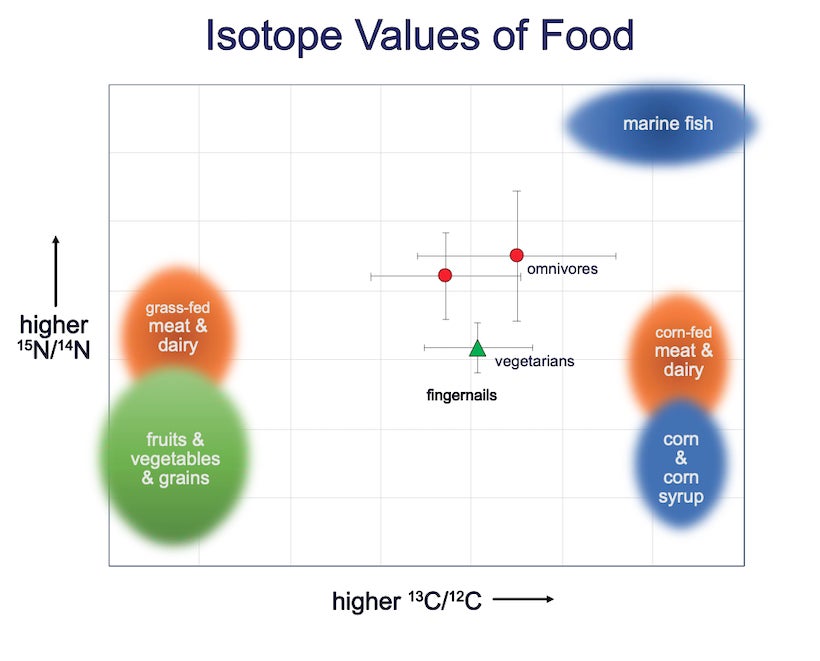
Isotope Values of Food

Food and comparison fingernail data:

plot of carbon and nitrogen isotopes of foods from the USA

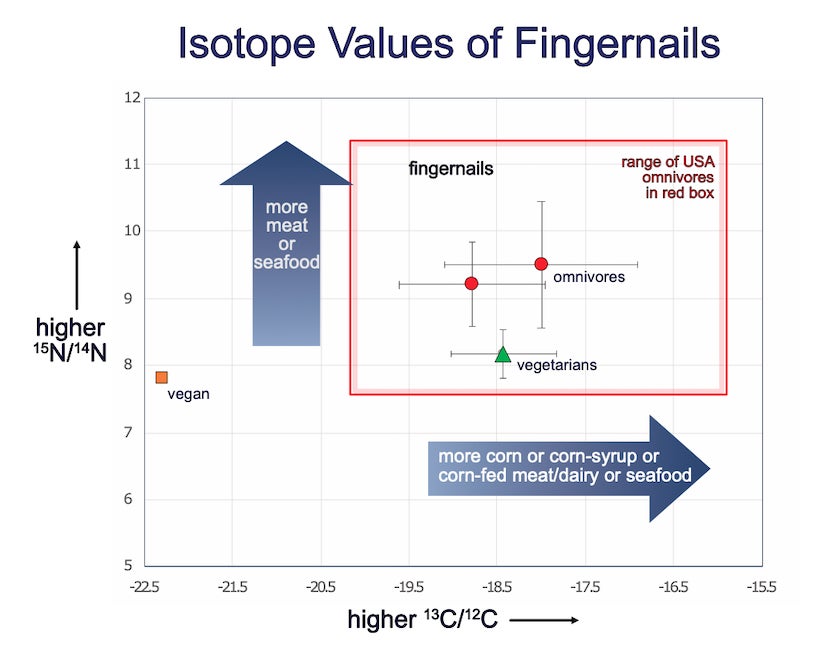
Isotope Values of Fingernails

plot of carbon and nitrogen isotopes from fingernails from US omnivores, vegetarians, and vegan

Note these are 2024 results below:

carbon and nitrogen isotope results of BSU visitor fingernails