Overview
A 5-day infiltration/recovery experiment was conducted in August 2011 at the Boise Hydrogeophysical Research Site (BHRS) to quantify variably-saturated flow behavior and parameterize moisture-tension-hydraulic conductivity relationships in an unconsolidated stony sediment sequence using hydrologic and geophysical methods. Prior to the experiment, we used drilling logs, core samples, soil tension and moisture profiles, and ground-penetrating radar to determine the 3D distribution and lithology of stratigraphic units.
Grain-size distribution from core data, laboratory infiltration experiments on core sections, and inversion of tension and moisture response to natural rain events were used to estimate hydraulic properties, including van Genuchten parameters, porosity, and saturated hydraulic conductivity.
Testing
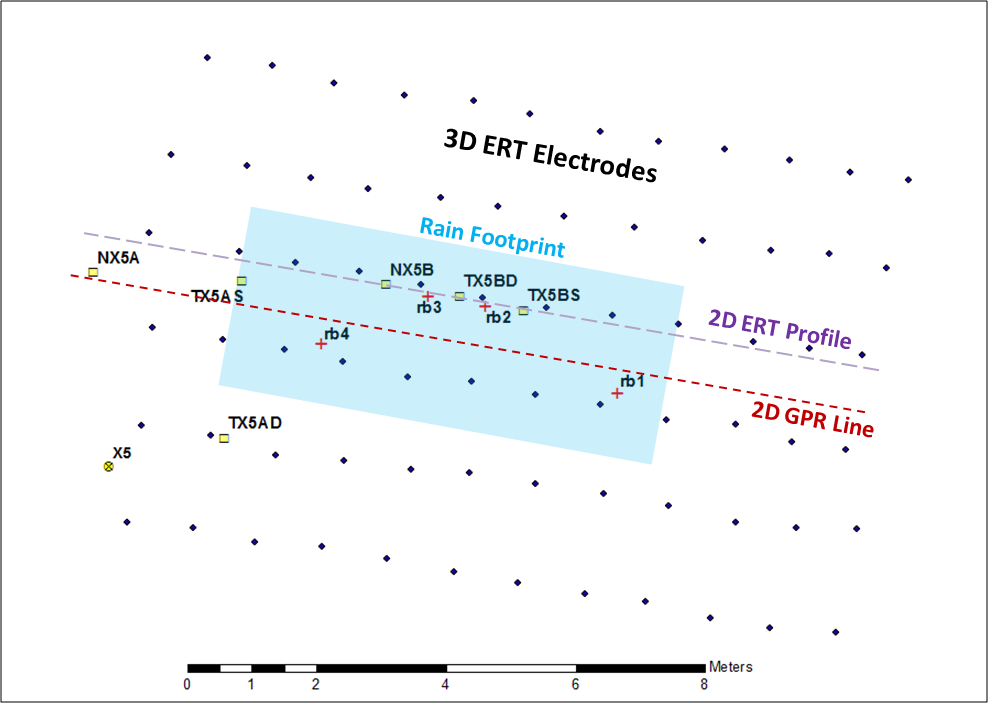
“Rain” was applied over the outlined area (~1cm/hr) while soil tension data (TX) were logged at three-minute intervals. 2D multi-offset GPR, 3D ERT, and neutron moisture profiles (NX) were collected hourly.
Tensiometer/Soil Moisture Response
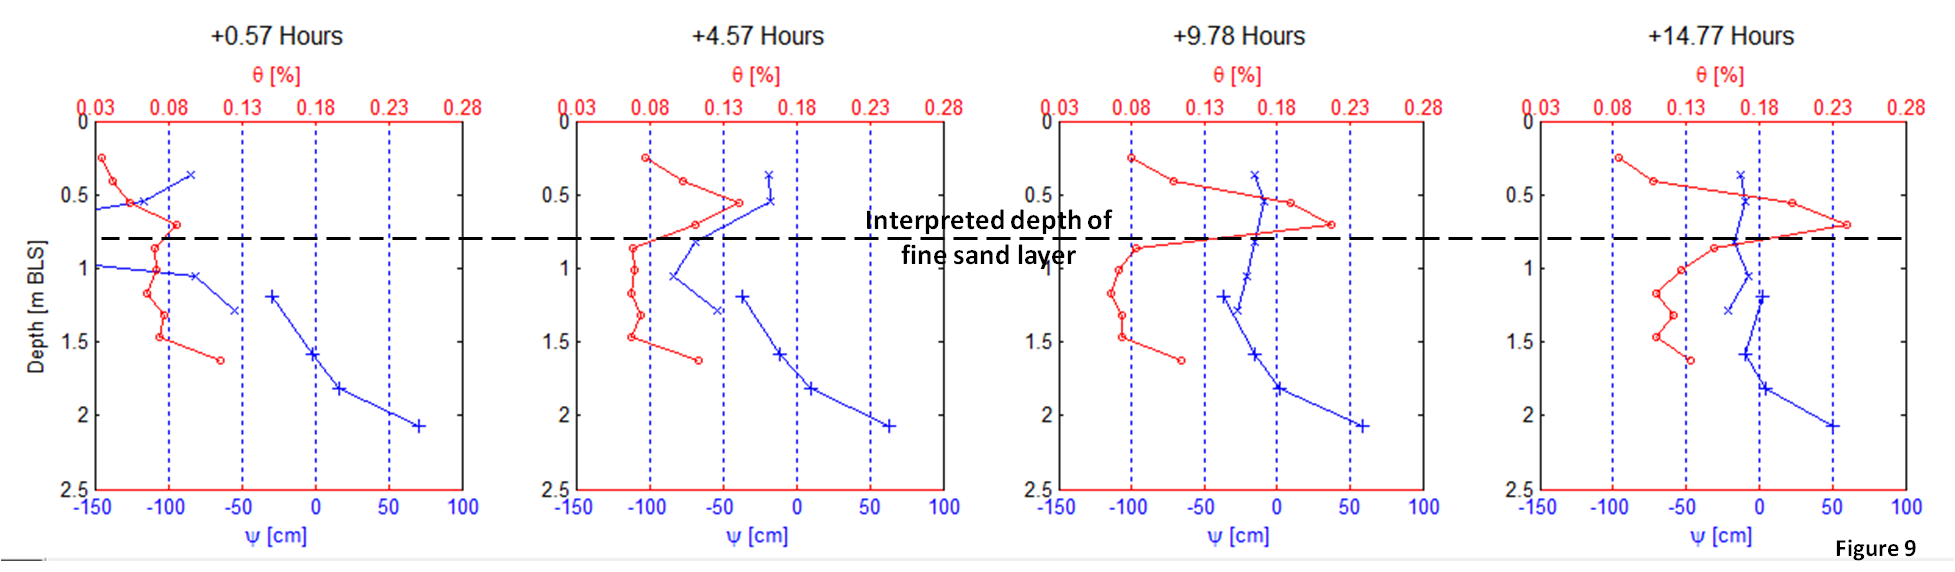
Similar response is seen between soil moisture and tension although at greater depths moisture responds slower than tension.
Geophysical Data
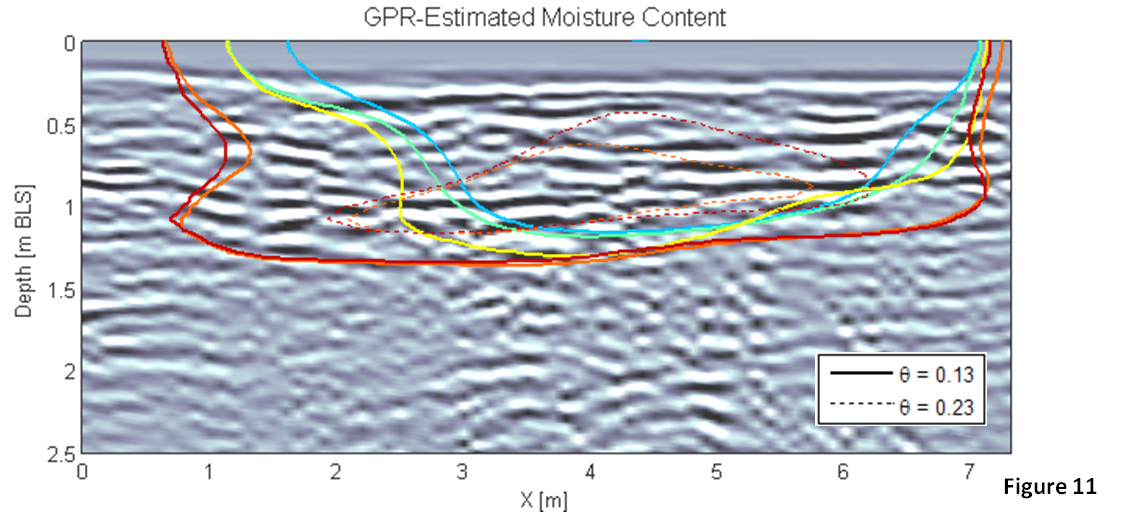
2D velocity analysis of GPR data and Topp equation were used to estimate soil moisture distribution. Both data sets show a delay in the wetting front at the approximate depth of the sandy layer and the effects of lateral heterogeneity caused by a dipping horizon.
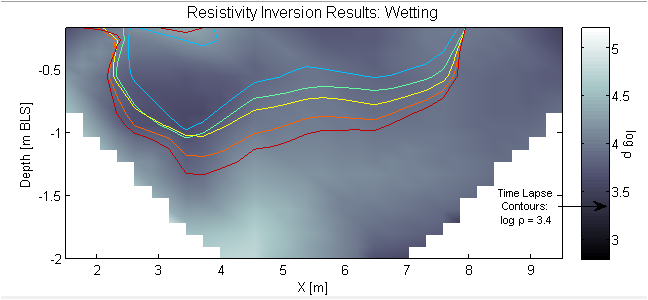
2D ERT was extracted from the 3D grid and processed using time-lapse inversion to obtain the distribution of resistivity over time.