Streamflow Measurement
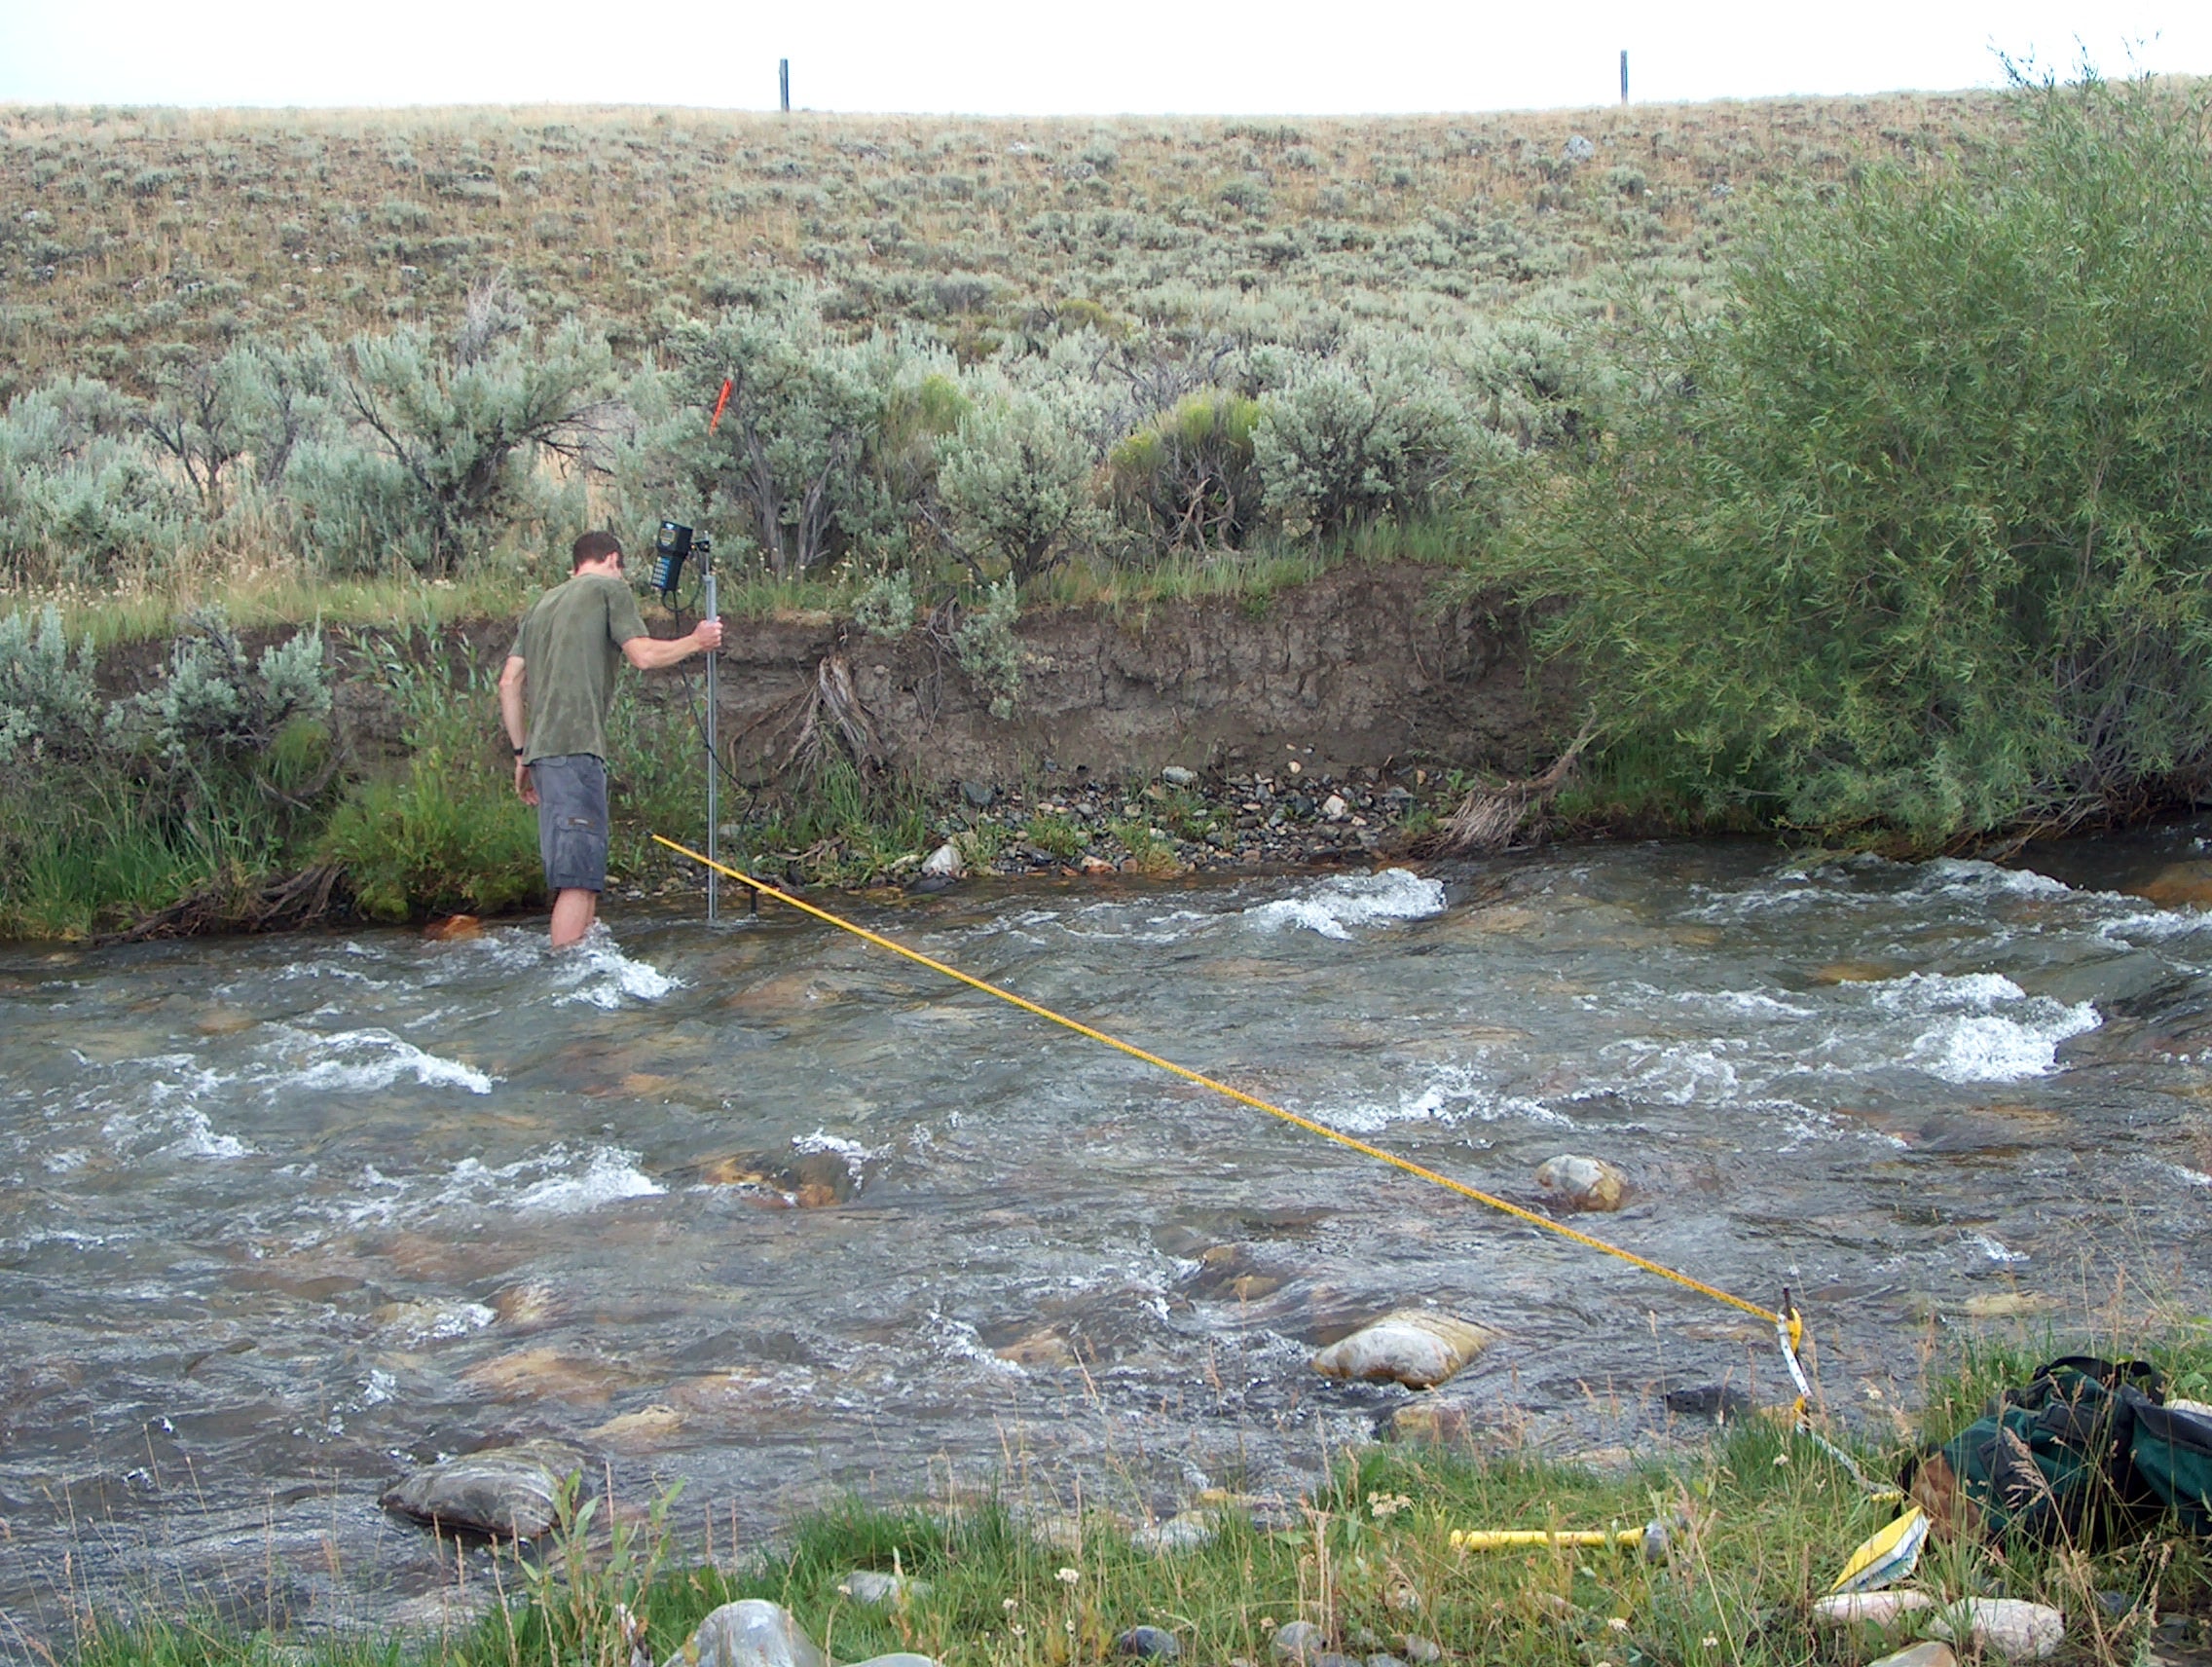
Problem
A streamflow hydrograph is a plot of continuous discharge against time, yet conventional measurement methods only provide instantaneous discharge values. How do we construct a continuous hydrograph?
Goal
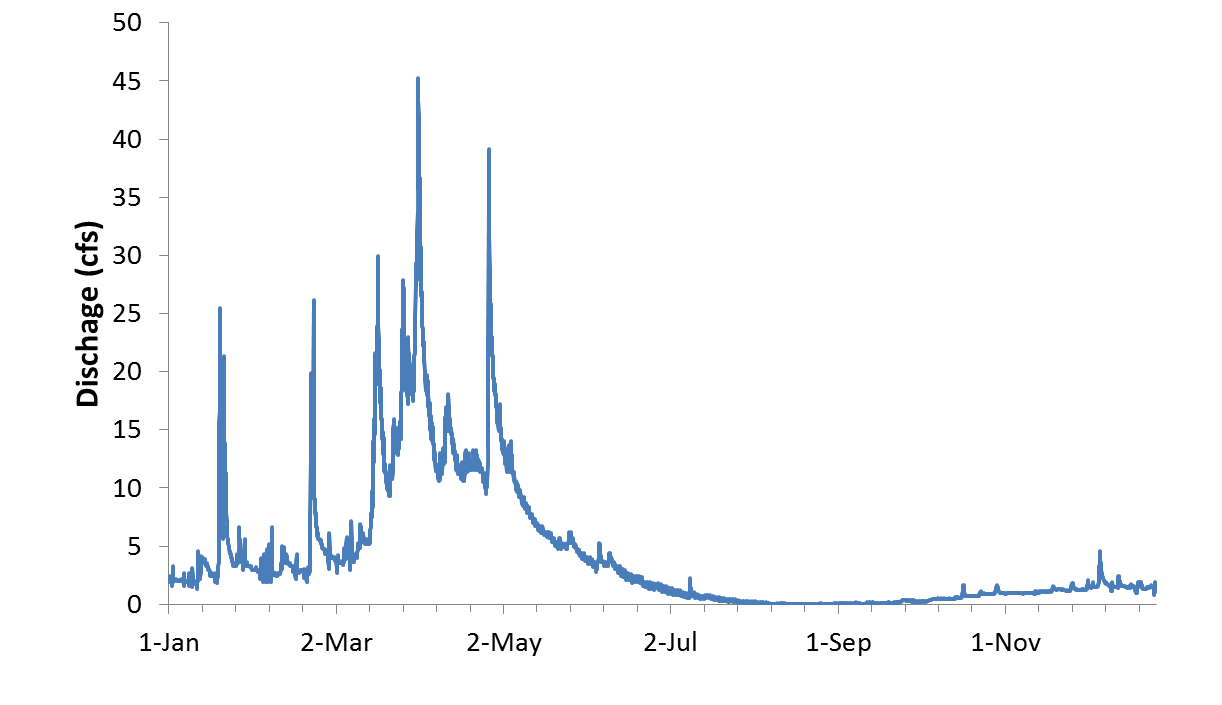
The goal of this project is to produce an annual hydrograph(s) for the Dry Creek Experimental Watershed (DCEW).
Learning Objectives
Upon completion of this exercise students will be able to
- Measure the instantaneous streamflow rate, or discharge, of a small stream using the velocity-area method (optional)
- Develop and use a rating curve relating stage to discharge
- Convert a continuous stage record to a hydrograph
Project Files
- Handout for field observations
- EXCEL workbook for calculations
Requirements and Connections
- Products of this exercise may be used by the Watershed Water Balance exercise
- This exercise requires stream stage (instantaneous/continuous measurements) and discharge, which can be either measured or calculated using DCEW Lower Gauge rating curve.
Producing a continuous hydrograph (record of discharge) involves obtaining a continuous record of stage, making discharge measurements over a range of stages, establishing and maintaining a relation between the stage and discharge, and applying the stage-discharge relation to the stage record.
Instantaneous Streamflow Measurement
Streamflow rate (Q), also called discharge, is calculated by multiplying the velocity (V) of the water and a stream’s cross sectional area (A):

The area is simply the width (W) of the river times the average depth (D). Because depth and velocity change through any cross section, several measurements must be made. In the velocity-area method, a stream gauger splits the stream into several cells, measures W, D, and V for each cell, calculates Q in each cell, and then adds up all the cells to get the total Q according to Equation 2:

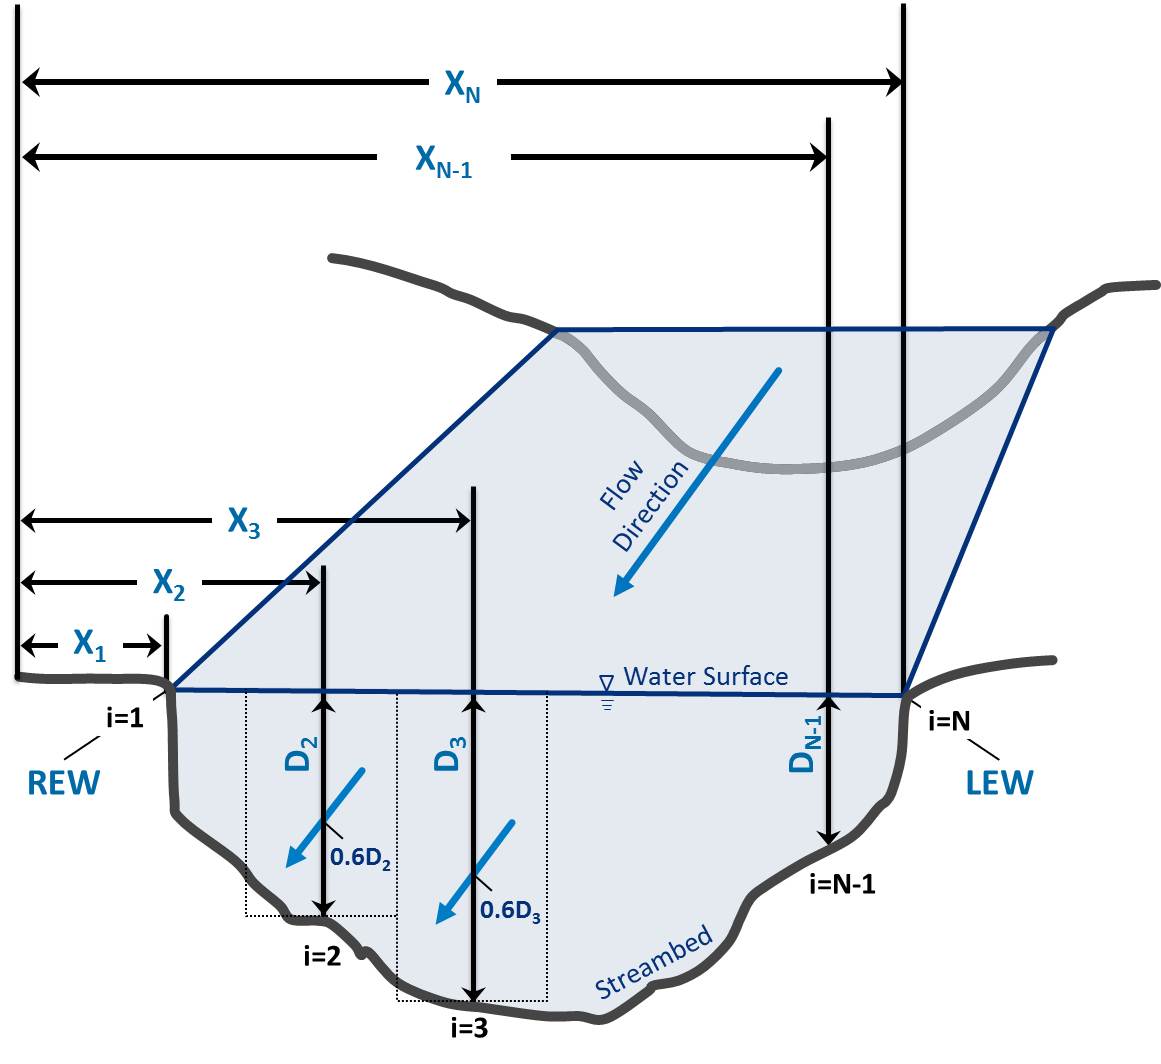
Equation 2 is a summation. The subscript i refers to any particular station in the cross-section. It can be considered as an address. If you are working at station i, the terms Vi and Di refer to the velocity and depth at that station, respectively. The terms Xi+1 and Xi-1 refer to the distances from a reference point to the next station and previous station, respectively. Everything to the right of the summation symbol is solved for each station, and the results for each station are summed to get Q.
The United States Geological Survey recommends 20 cells in a cross section. The stream gauger moves across the stream measuring the distance from the bank to keep track of width, and takes a depth measurement at a station (i), as illustrated in Figure 1. Velocity must represent the average velocity in the vertical profile. The minimum velocity in a profile occurs at the bottom, the maximum occurs near the top. Rather than making several measurements to average, we assume for streams less than 1 m deep that the average velocity equals the velocity that occurs at 60% of the depth measured from the top. After measuring depth of a profile, the gauger places a current meter at 0.6 times the depth to measure the average velocity for that profile. This is commonly done automatically using a top-setting rod.
Continuous Streamflow Measurement
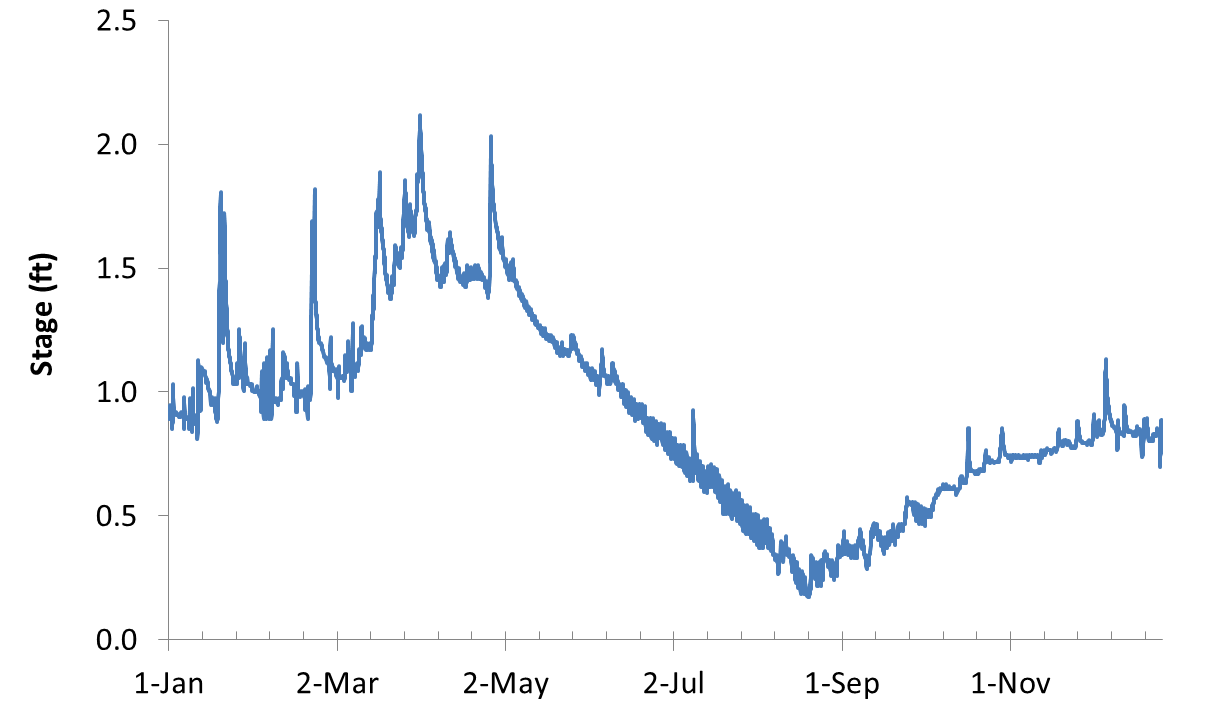
The velocity-area method gives us the discharge of a stream only at the time of measurement. Continuous measurement of discharge is very difficult. However, continuous measurement of water depth, or stage, is straightforward (Figure 2).
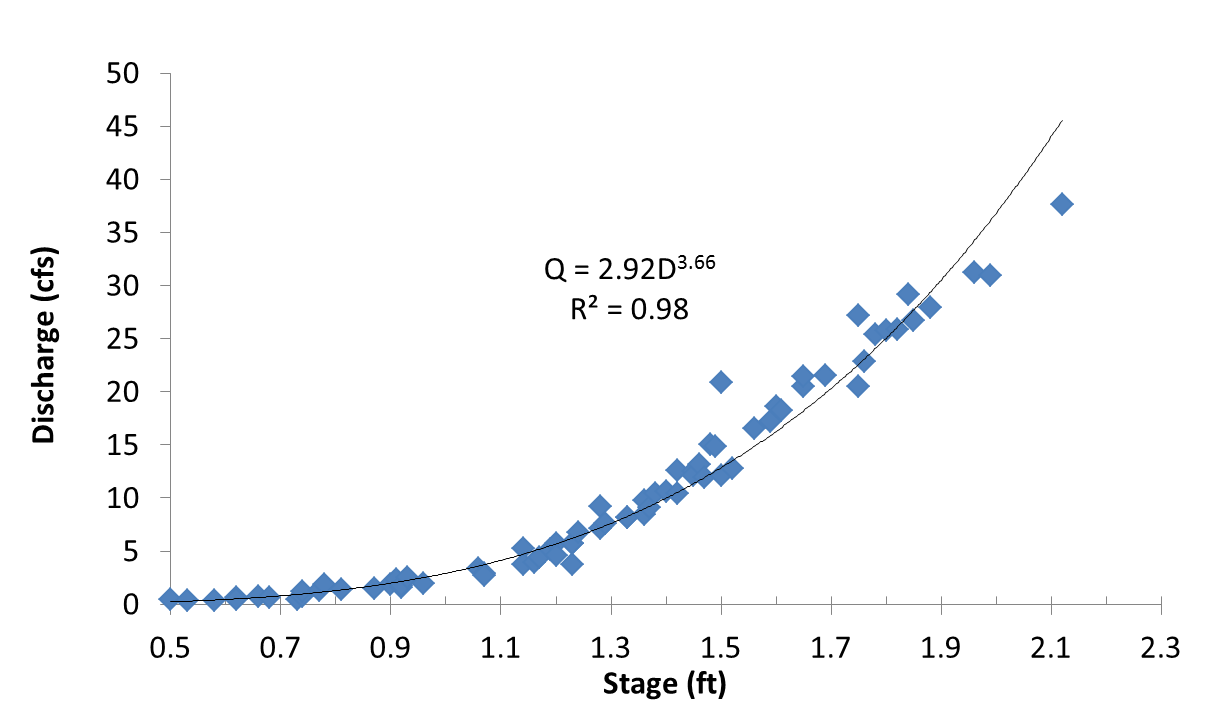
By using a known mathematical relationship between stage and discharge (Figure 3), we can convert a continuous stage record to a continuous discharge record (Figure 4).
A stage-discharge relationship (Figure 3) relies on the principle that there is an observable relationship between discharge (Q) through a cross-section and stage (D), or depth, measured at an index location. Stage is simply the height of the water surface relative to the height of a reference datum. As discharge rises and falls, stage also rises and falls. The stage-discharge relationship typically takes the form

where a and b are curve fitting parameters. When a stream gauger measures discharge by the velocity-area method, he/she records the stage. Equation 3 can be for a gauging station after numerous measurements over a range of stages are completed.
The stage-discharge relationship is valid only for the point of stage measurement. Whereas discharge measurements can be made in any reasonable cross-section near the stage recorder, the location of the stage-recorder, and the channel geometry, cannot change.
Stage is typically measured in permanent index locations visually on a scale, or by many analog digital recording devices. Such devices are commonly installed in a stilling well to reduce noise induced by wave action.
Goal
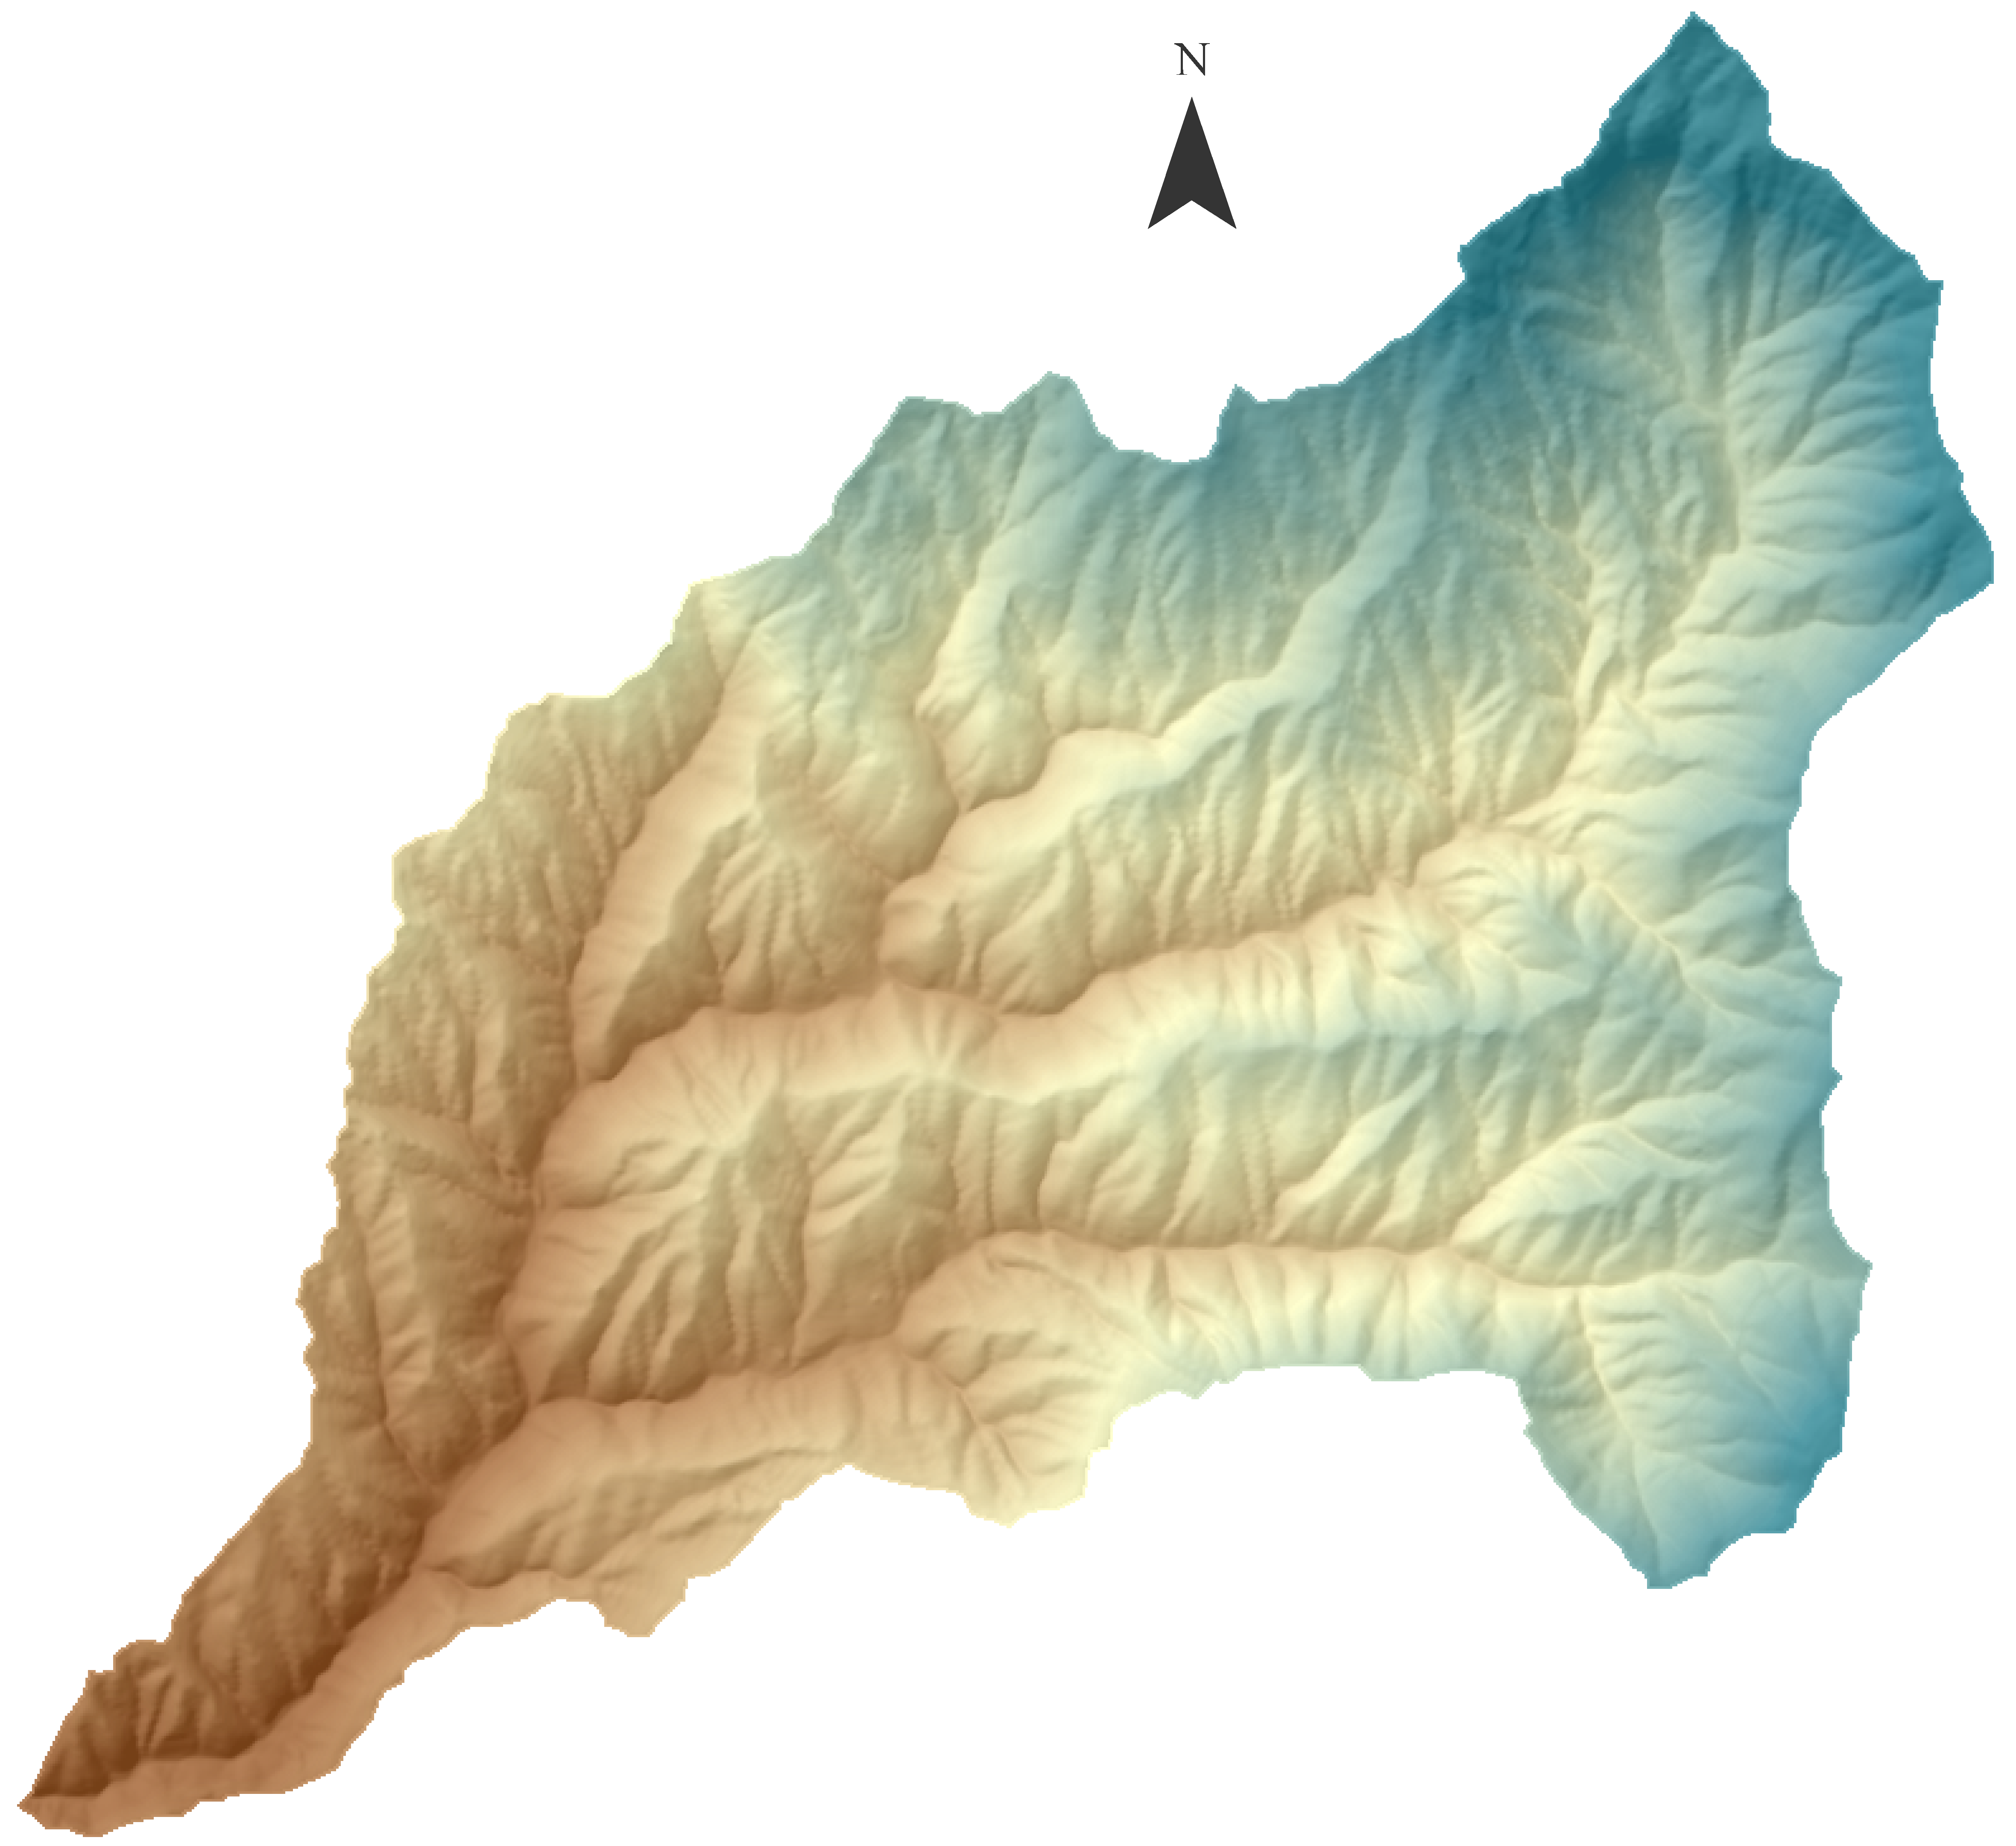
Produce annual hydrograph(s) for the Dry Creek Experimental Watershed.
Project Files
Requirements & Connections
- Products of this exercise may be used by the Watershed Water Balance exercise.
- This exercise requires stream stage (instantaneous/continuous measurements) and discharge, which can be either measured or calculated using DCEW Lower Gauge rating curve.
Instructions
The instructions below outline specific steps to complete the entire exercise. Instructors may assign part or all of the exercise, or may add additional requirements. Students should consult with their instructors for specific instructions. All students should ensure that they understand the problems and goals of this exercise by reviewing the information in the INTRODUCTION and BACKGROUND tabs of this page. Although completion of the field exercise to measure instantaneous discharge (Step 1) is important, it is not necessary to complete the remainder of the project. Rather, students can use previously collected data available in the “Previous Field Measurement” tab in the EXCEL workbook provided.
1. Measure Discharge using the velocity-area method (Field Work)
Students not completing the field exercise, skip to step 2.
On the hike into the field site, the instructor may stop to point out the Lower Gauge station where stream stage is recorded. For some parts of this exercise, it is necessary to know the stage at the approximate time of when the field measurements are made. The instructor will then guide students to a nearby site amenable to group activities. Once at the site, students will divide into teams, each team will be given tools to make the necessary measurements following the procedures below. Record all data for the following steps in either a paper or electronic version of the Field Observations Handout:
- Select an appropriate cross-section for discharge measurement.
- Stretch the measuring tape across the creek; note the locations of the right water edge and left water edge.
- Based on the width of the stream and the distribution of flow, determine the locations of at least 10 stations in the cross-section for depth-velocity measurements.
- At each station:
- Record the position of the station (location on the tape)
- Measure depth of water using the top-setting rod
- Place the velocity meter, mounted on the top-setting rod, at 60% of the depth from the surface
- Measure the stream velocity according to the instructions for the instrument provided
- Record stage and time. Stage may be provided later by the instructor.
- Compute the discharge using Equation 2 [SEE BACKGROUND].
Instructors may also ask students to estimate discharge by a variety other methods including the “stick-float” method or simply intuitive guessing.
2. Develop a Rating Curve (A Stage-Discharge Relationship)
- Download and open the EXCEL workbook.

- If you participated in the field exercise, populate the “Class Field Measurement” tab with the field data. If you did not participate in the field exercise, use data in the “Previous Field Measurement” tab. In either case, compute the total discharge using Equation 2 [SEE BACKGROUND].
- Add your discharge and stage measurements to the bottom of the rating curve data in the “Rating Curve” tab.
- A scatter plot of discharge (y axis) against stage (x-axis) is automatically generated. Your data should now appear on the plot.
- Use EXCEL tools to obtain an equation that predicts discharge from stage. A power function typically works best.
- Right-click on the data series within the plot.
- Click the Add Trendline option
- Under Trendline Options select “Power”, “Display Equation on Chart”, and “Display R-squared value on chart”, then click OK. Observe how well or poorly the modeled line fits the data. Does it fit over the entire data range?
- Enter the parameters (a and b) of the equation into the table provided in the Rating Curve worksheet.
3. Create a Hydrograph

- Use the equation developed in step 2e to convert stream depth recorded at our permanent gauging station to discharge
- Open the “LG_2009” tab. Column b contains a record of stage (ft) for every hour in 2009
- Type the equation developed in step 2e in the cell next to the first stage value. In this step you are converting stream depth (column: ‘Stage-ft’) to instantaneous discharge (column: ‘Discharge-ft3/s’)
- Apply the equation to all appropriate cells for every hour in the year.
- Convert the ‘Discharge-ft3/s’ to ‘Discharge-L/s’ in the neighboring column.
- Repeat step 3a for stage recorded in other years as assigned.
- In “Hydrographs” tab create a scatter-plot displaying Discharge (L/s) versus Time for each year.
4. Discussion Questions
- You added a stage-discharge pair measured in the current year to rating curve data that was generated over many years to produce hydrographs for historical years. By doing so, what assumption are you making about the stage recorder and cross-section at Lower Gauge?
- Find the highest hourly discharge that occurred during all years that you evaluated. Explain potential sources of error in this value. Consider the accuracy of the rating curve at high flows, as well as the accuracy of field measurements.
5. Final Products to Submit
Unless instructed otherwise by your instructor, turn in the following:
- Field observations worksheet (class observations or previous observations) showing completed calculation of instantaneous discharge
- Rating curve plot with equation
- Annual hydrograph
- Answers to discussion questions as assigned by instructor