Soil Moisture
Goal
The goal of this data exploration exercise is to illustrate the influence of soil properties on temporal patterns of soil moisture. The exercise does not contain deliverables to turn in as part of a class exercise. Rather, the instructions are guidelines for self-guided learning.
Learning objectives
Upon completion of this exercise students will be able to
- Describe temporal patterns in soil moisture
- Calculate soil water storage from volumetric soil moisture measurements
- Determine basic soil hydraulic properties from a soil moisture time series
- Calculate basic soil hydraulic properties from soil texture data
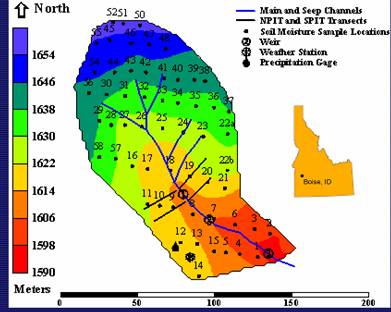
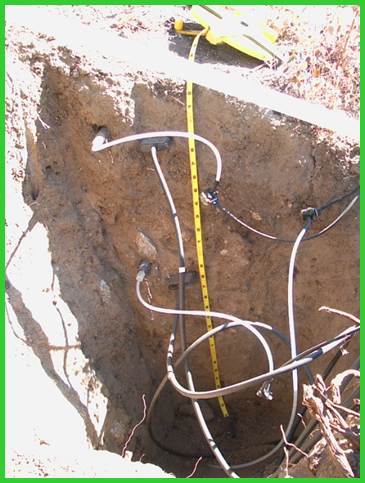
In this exercise you will analyze historical soil volumetric moisture content data collected at the Treeline Site (Pit 4). These soil pits were installed in 1999 along with the meteorological station, and are located approximately 2 meters apart from each other at a mid-slope location on the northeast facing aspect.
These sections are designed as data exploration exercises without specific products to hand in. Consult instructor to determine if discussion questions and calculations should be turned in for assessment.
A. Annual patterns in soil moisture content
- Download this Excel file containing continuous records of soil volumetric moisture content (VMC) from 1/1/2009 through 12/31/2012, at five depths in a pit at the Treeline site. Also included in separate workbook tabs are the corresponding streamflow and precipitation data from the same site.
- Evaluate the temporal patterns of soil moisture presented in Figure 1 in the tab labeled “Soil Moisture 2009-2012”. The data are contained in columns A – G. Here are some patterns you should see:
- Summer months exhibit relatively low and consistent moisture contents.
- Infrequent summer rains temporarily increase near surface moisture contents, but the wetting fronts typically do not reach all depths.
- Fall rains elevate moisture contents to a relatively high and consistent values.There is a time lag between when shallow and deep sensors reach this high moisture content state.
- After the high moisture content state begins, water input events (rain or snowmelt) temporarily increase moisture contents, but moisture does not drain to the low values exhibited in summer.
- Discussion Question: Why does the VMC stay at a relatively high state during winter, as opposed to draining to the low values that occur in summer?
- Discussion Question: Why does the VMC stay at a relatively high state during winter, as opposed to draining to the low values that occur in summer?
- In the Spring, the VMC decreases below the Winter high state, reaching a relatively low state. Occasional rain events may interrupt this decline, but in general, summer rains have little impact.
- Discussion Question: Why does the VMC not decrease to zero?
- Discussion Question: Why does the VMC not decrease to zero?
B. Soil Water Storage
VMC data indicates how much water exists within an arbitrary sample volume of soil. It is also valuable to know the absolute amount of water that exists in a soil profile (soil water storage). Storage is calculated by integrating VMC over the depth of the soil profile. Because we do not have spatially continuous moisture measurements, we divide the profile into discrete depths around the soil moisture sensors in each soil layer as described by the following equation:
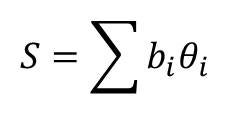
where b and θ are the thickness and VMC for soil layer i. In the “Soil Moisture 2009-2012” worksheet tab, the ‘blue’ column headings (Cells B11-F11) are the depths (cm) where each soil moisture sensor is placed (5, 15, 30, 45, 60) below ground surface. We will assume that the representative thickness, bi, for each sensor extends half the distance to adjacent sensors. For the shallowest sensor, the representative thickness begins at the surface. For the deepest sensor, the representative thickness extends to the soil bedrock interface. In this case, the depth of soil is just a bit below the 100 cm sensor. We will assume that 100 cm is at the base of the profile so that it’s representative thickness is half the distance to the sensor above it.
Calculate the depth of soil water stored in each time step according to the following instructions:
- In the ‘red’ cells above each depth, enter an equation to calculate layer thickness based on the concepts described above. If you are doing the calculations correctly, your upper two layers should have thicknesses of 10 cm and 12.5 cm. Check to ensure that the sum of all thicknesses equals 60 cm.
- In the column labeled ‘Storage’ to the right of the deepest VMC column. Use the equation above to calculate moisture storage in each time step.
- Create a scatter plot of storage versus time for 2009-2012.
- Discussion Question: Approximately what proportion of annual precipitation is stored as soil moisture in the winter and summer?
C. Seasonal Precipitation – Soil Moisture patterns
- The tab “2011 Water Year” contains a plot of soil moisture at all depths versus time plot for Oct 1, 2010-Sep 30, 2011.
- Plot cumulative precipitation for the 2011 Water Year on a secondary y-axis of the “2011WaterYear plot”. Note, the data in the “Precipitation 2009-2012” worksheet tab are reset to zero by calendar year. For the 2011 Water Year, you will need to create a new cumulative precipitation time series beginning at zero on October 1, 2010 reaching a maximum on Sep 30, 2011.
- Describe any interesting observations. Here are a few observations/questions:
- The first couple weeks of October mark the end of the summer dry period. A moderate rain event on October 23rd cause near surface VMC to rise to the wet state. Deep soil moisture, however, remains low until mid-December.
- A rain event on November 6th causes another peak in VMC. Precipitation continues off and on through December 6th. However, VMC decrease to relatively stable levels. Similarly, near surface VMC remain relatively stable from around December 20-January 11. During this same period, precipitation increases by approximately 80 mm.
- Why does VMC decrease while precipitation increases?
- On February 11th, near surface moisture contents increased without any new precipitation.
- What happened?
- For nearly a month between January 19-Feburary 15 essentially no precipitation fell as either rain nor snow, but VMC did not drain to dry conditions. The month of July also had essentially no precipitation. However, during this period, VMC decreased precipitously.
- Why did moisture contents decrease in July but not in January?
D. Estimate the depth of soil wetting from an intense rain event
The hydrologic response of soils and streams to water input events depends on: meteorologic properties of the event (depth and duration of input), physiographic properties of the landscape, and the wetness state of the watershed prior to the event.
Here, we evaluate the hydrologic response of two water input events under different antecedent moisture conditions. Complete the following in the “Select Rain Events” worksheet tab.
- On August 6, 2009 soil moisture increased dramatically in response to a large rain event.
- Create a scatter plot of VMC for all depths versus time for this event. The duration of the plot (x-axis) should capture the complete recession of VMC.
- Question: What was the minimum depth of infiltration for the event?
- Populate the ‘Storage’ table with the soil profile’s storage at event’s start and end times.
- Plot cumulative precipitation on a secondary axis on the above soil moisture plot. Populate the ‘Precipitation’ table with the event start and end times as well as the initial and final cumulative precipitation. Determine the depth and intensity of the rain event that produced the soil moisture response.
- In the Annual Patterns section above you estimated field capacity. This is the relative amount of water that the soil can hold against gravity, which will effect the depth of infiltration during a precipitation event. However, a portion of the field capacity is taken up by antecedent moisture. Determine the available storage porosity by subtracting antecedent moisture content from the field capacity.
- Assume that all rain infiltrated the soil (no overland flow occurred), and that a wetting front propagated downward into the soil leaving soils at field capacity.
- Based on your estimates of available storage porosity and the total depth of precipitation, how deep would you expect the wetting front to reach?
- Do the soil moisture observations support your answer?
- Determine the total change in soil water storage.
- How does this value compare to the depth of precipitation?
- Repeat steps 1-5 for a storm that occurred between 5/14/2011 and May 17, 2011
- Discuss the differences in hydrologic response between the two storms.
- Were there differences in the depth of infiltration?
- The “Streamflow 2009-2012” tab contains a plot of streamflow for the four years of this exercise. Note that the stream is ephemeral. Briefly describe the differences in streamflow response between the two storms.
- Which storm had the higher precipitation input, and which storm had the higher streamflow response?
E. Soil texture and hydraulic properties
The textural properties of a soil determine the extent to which water will remain in the soil against external forces of gravity drainage and evapotranspiration, and therefore exert strong controls on the spatial and temporal patterns in soil moisture described above. In general, similar soils tend to show similar hydrologic response. Accordingly, the hydrologic behavior of soils is commonly estimated using soil texture descriptions. The term “soil hydraulic properties” refers to the set of relationships between soil textural properties, soil moisture content, soil water tension, and hydraulic conductivity. Equations to compute soil hydraulic properties based on soil texture are called pedotransfer functions. Several empirical relationships based on soil texture have been developed to quantify the moisture retention curves (see Dingman 3rd edition Table 7-4).
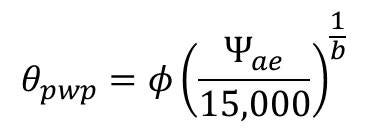
This exploration focuses on simple manifestations of these relationships in the concepts of field capacity and wilting point. Field capacity is defined as the soil moisture content below which further drainage occurs at a negligible rate. It is an index that defines how much water a particular soil can hold against gravity. Wilting point is the soil moisture content below which plants can no longer extract water. Both quantities are related to the ability of water to cling to soil particles under stress (gravity and capillarity). Common assumptions are that gravity drainage becomes negligible at about 33 kPa (340 cm) of tension, and plant water extraction ceases at around 15,000 kPa. The moisture contents associated with these pressures are the field capacity and wilting point, respectively, and can be obtained from equations describing the moisture retention curve for a particular soil.
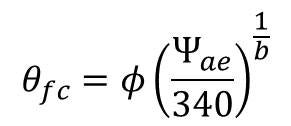
If we substitute assumed values of pressure head for field capacity and wilting point, the Campbell (1974) pedotransfer function can be rearranged to solve for the corresponding soil moisture contents for field capacity and wilting point
In the steps below we will describe and classify the Treeline soils.
- Open the “Soil Properties” workbook tab. This worksheet contains a suite of soil analyses for a soil sample collected at 30 cm depth.
- The gray box contains grain size distribution data. In cells E9-E17, calculate the Percent Finer for the sieve analyses. A plot will be automatically generated and added to the “Mastersizer” analysis for fine particles.
- In the blue box, calculate the percentages for each textural class for the non-adjusted and adjusted classifications.
- Classify the soil according to using the USDA Soil Triangle.
- In the orange box, complete the calculations to determine the specific gravity, bulk density, and porosity of the soil.
- Compute field capacity and wilting using the Campbell method and by observation
- Use Dingman table 7-4 and equations above to determine the field capacity and wilting point.
- Revisit the soil moisture plots created above. Estimate field capacity and wilting point by evaluating when reductions in soil moisture content due to gravity drainage and evapotranspiration cease.
- Describe how estimates of field capacity and wilting point derived from the pedotransfer functions compare to observations
- Construct a characteristic moisture release curve using the Campbell method
- Enter data from your soil classification above into the green table in the Soil Properties tab.
- In the Moisture Retention Curve table, solve for pressure head using the Campbell (1974) approach. The Hanging Column data are results from a laboratory multi-step outflow test on the same soil core. How does the Campbell pedotransfer compare to field data?