Hydrograph Separation

Introduction
Problem
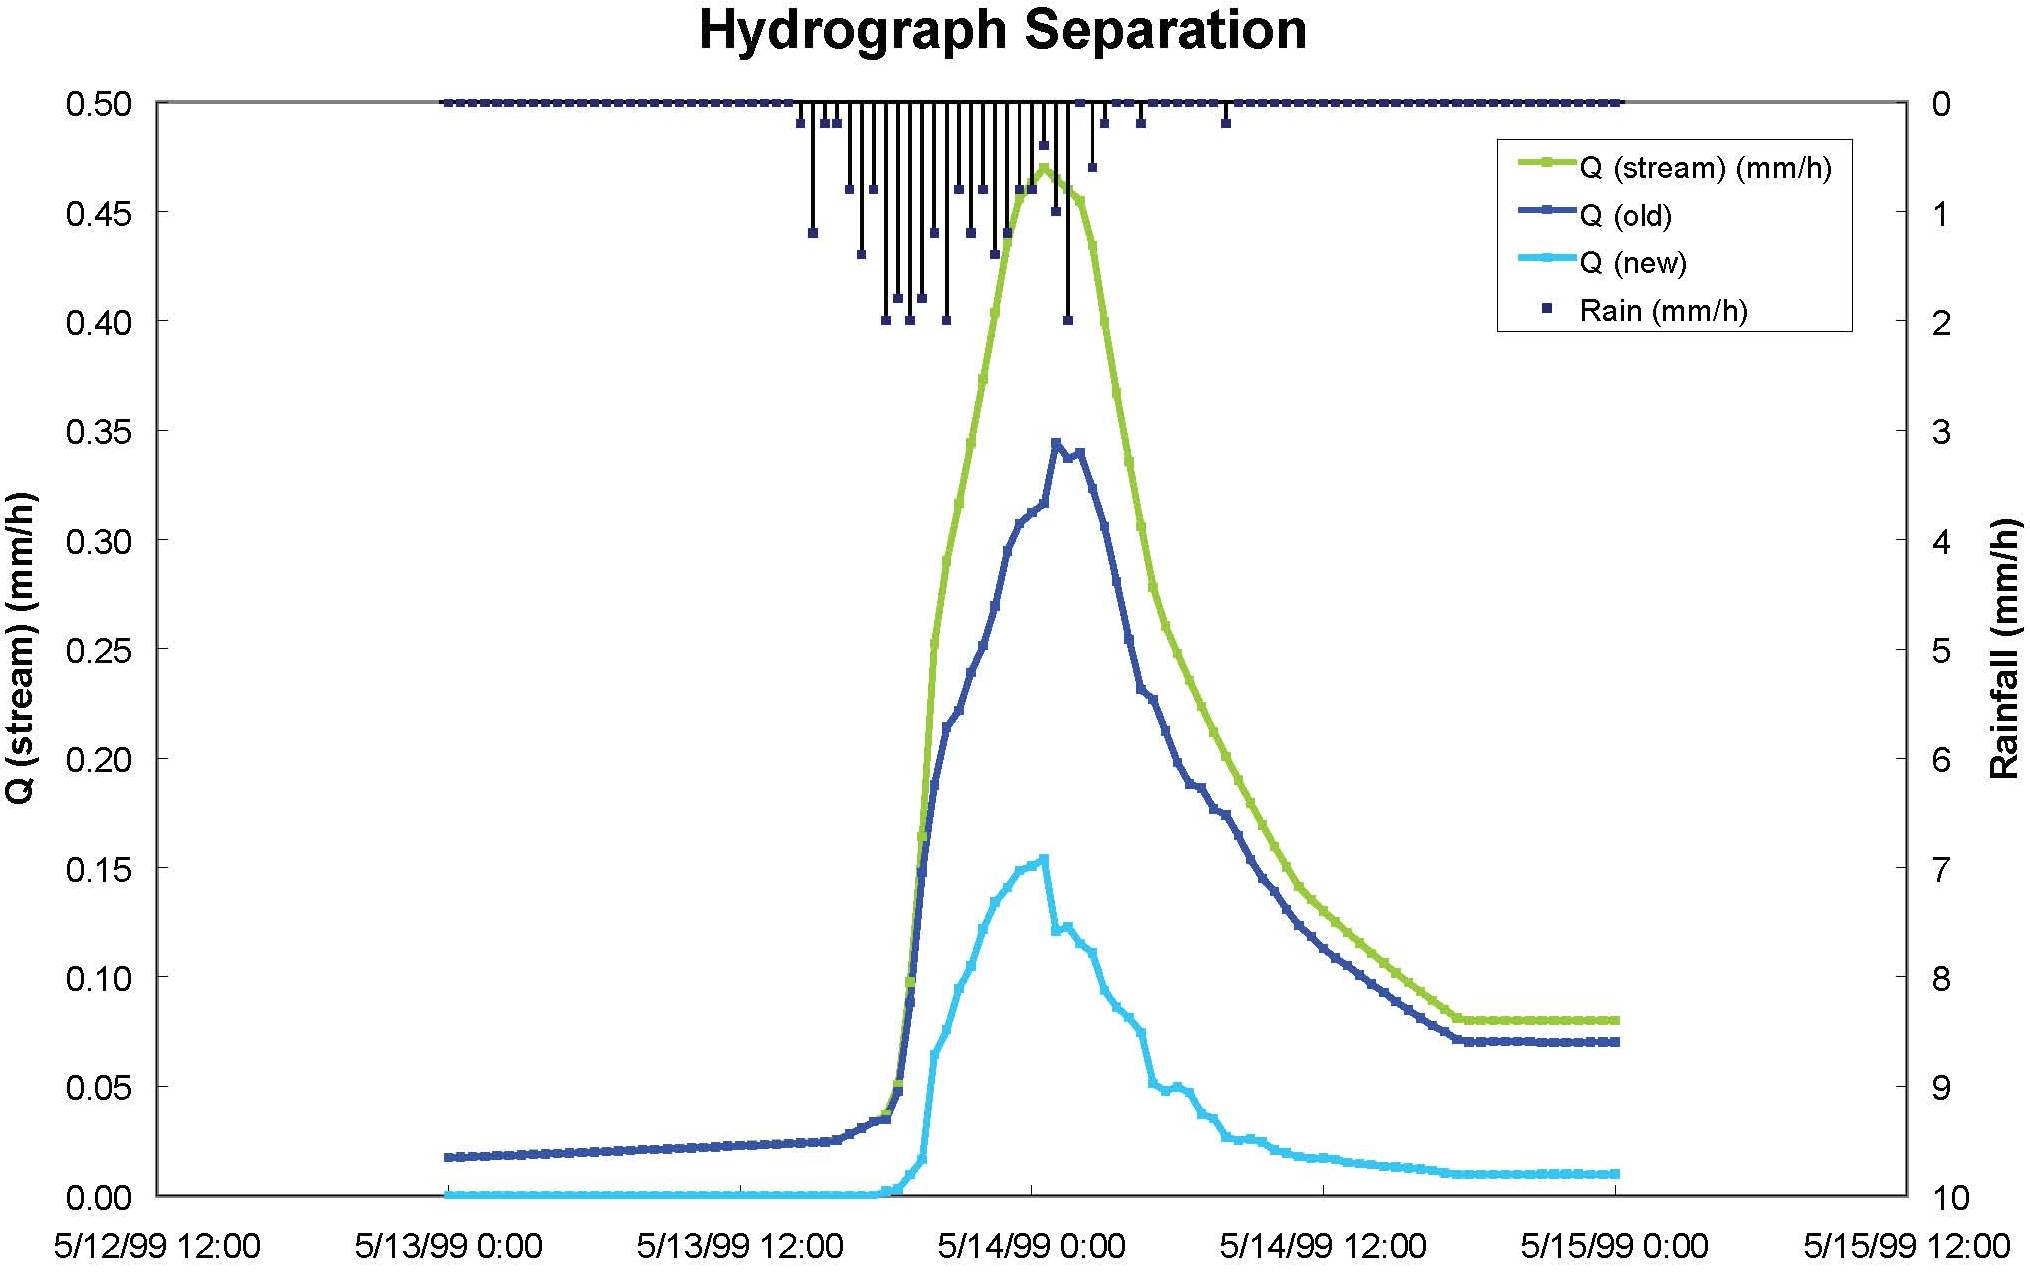
A hydrograph depicts the response of a stream to rainfall or snowmelt. What can hydrographs tell us about watershed processes?
Goal
The goal of this project is to partition a storm hydrograph into event flow and baseflow components, and old and new water components
Learning objectives
Upon completion of this exercise, students will be able to:
- Separate a storm hydrograph into
- baseflow and eventflow using graphical methods
- old water and new water components using an end member mixing model
- Describe the purposes of each hydrograph separation approach
- Describe the impact that common end member mixing results has on hydrologic science and engineering
Project Files
Requirements and Connections
- Streamflow hourly time series
- Basic knowledge of plotting hydrologic variables in time series
- Skills learned from the Watershed Water Balance exercise (e.g., calculation of the effective depth of streamflow)
Background
A storm hydrograph depicts a streams response to a water input event (rainfall or snowmelt) in graphical form (Figure 1). The term hydrograph separation refers to various analyses that are commonly performed to decompose hydrographs into sub-hydrographs. It is important to recognize that hydrograph separations are performed to answer two distinct questions:
- What is the volume of water that was added to the stream?
- What is the source of water that was added to the stream?

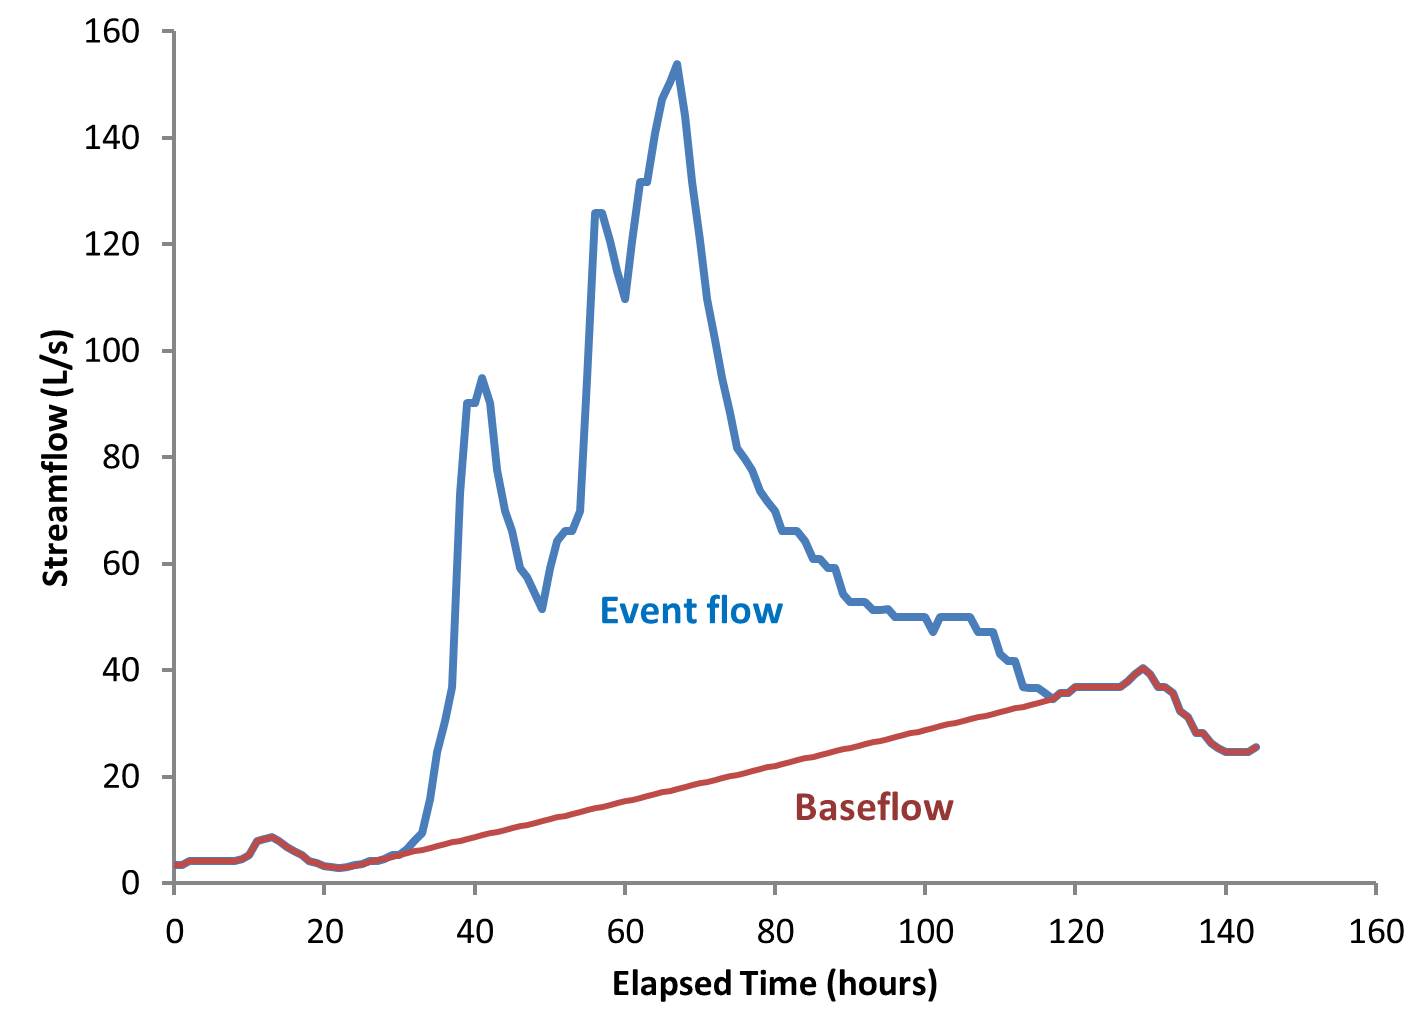
In the first question, hydrographs are separated into ‘Event Flow‘ (sometimes called ‘Quick Flow’) and ‘Baseflow‘ (sometimes called ‘Delayed Flow’) in order to understand the magnitude of hydrologic response (Figure 1). Event flow originates from the volume of water that was added to the stream during the event. Baseflow is the flow that would have occurred if the event had not occurred. The separation of Event Flow from Baseflow can be done by relatively simple graphical means. Engineering hydrology textbooks describe many methods to essentially draw a line across a hydrograph beginning at the time of initial rise to a point on the recession limb determined to be the end of the event. Portions of the hydrograph above the separation line are event flow, portions below the line are baseflow. Methods to determine that end point are approximations subject to user decisions. In large events, small errors in selecting the end of the event have little effect on the resulting volumes of event flow and baseflow. The volume of event flow can be computed by calculating the graphical area between the baseflow and total hydrograph lines. This analysis can be used to calculate runoff ratios and the timing of hydrologic response.

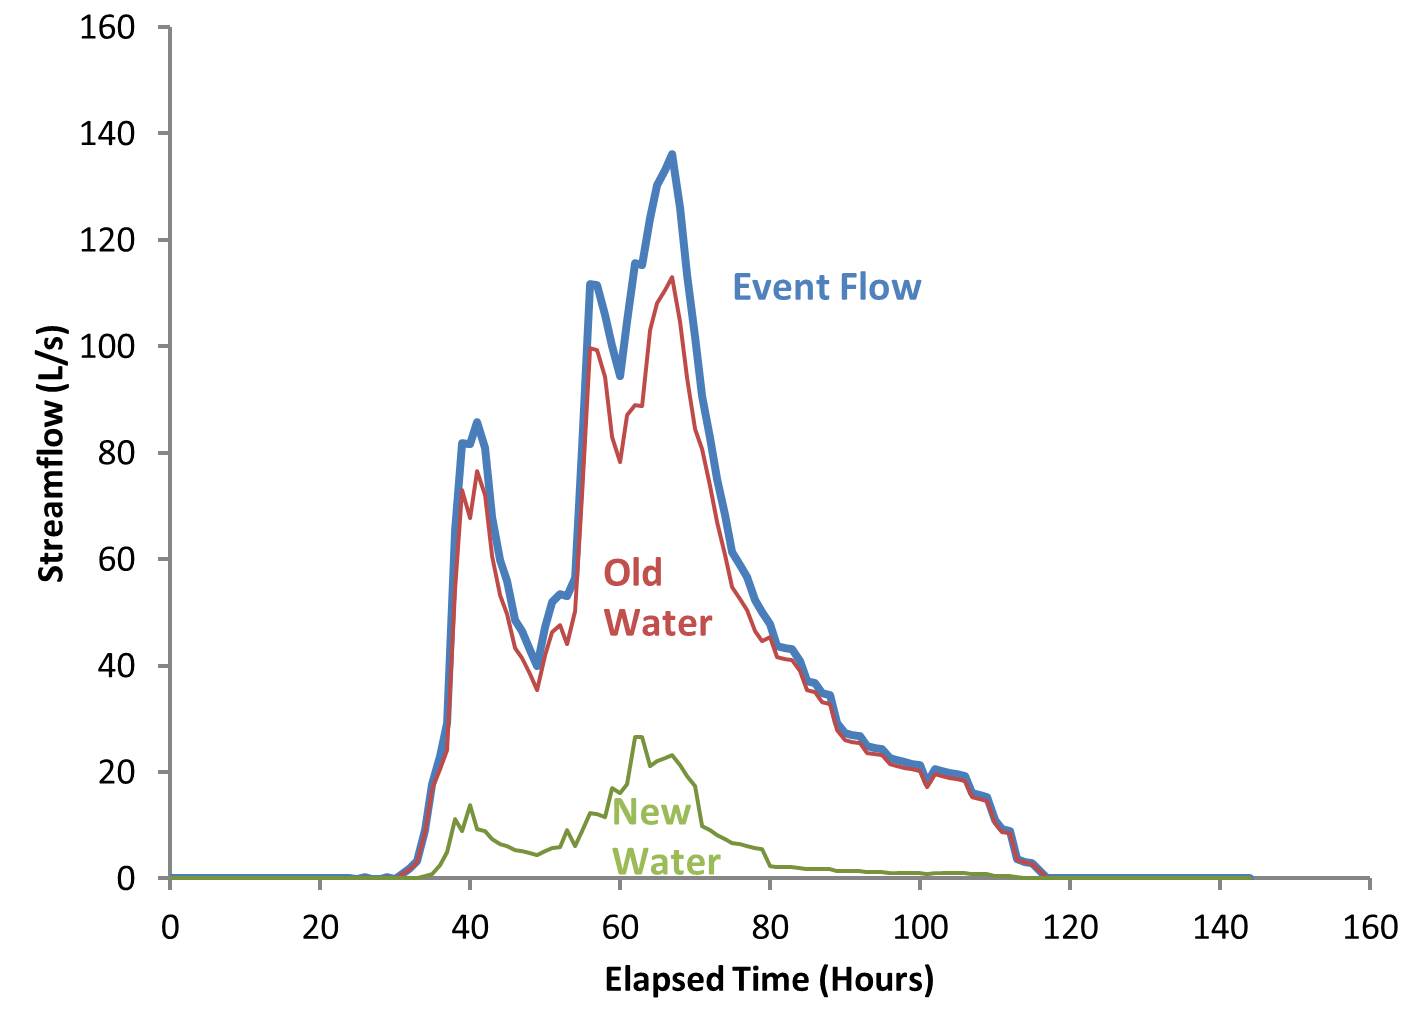
In the second question, hydrographs are separated to determine the origin of water that arrived in the stream. A simple conceptual model is that event flow is a mixture of water that was added to the watershed during the event (rain and snowmelt), called New Water, and water that existed in the watershed prior to the event (groundwater and soil moisture), called Old Water (Figure 2). If each source has a distinct chemical signature, a two end-member mixing model can be used to identify the proportions of total stream flow contributed by each end member (see below).
It is important to recognize the Event Flow can be a mixture of New Water and Old Water. Unfortunately, Event Flow is often equated with New Water, and Baseflow is often equated with Old Water. Confusion over these terms has led to widespread misconceptions over how rainfall or snowmelt gets to streams. This is a longstanding problem in Hydrologic Science, as the two approaches to hydrograph separation address two entirely different questions. Water added to a watershed during a rain or snowmelt event is NOT necessarily the same water that appears in the resulting streamflow event. Not all rain makes it to the stream during the event, and not all streamflow originated from the events rain. This hydrograph separation exercise is designed to illustrate this important difference.
End-Member Mixing Model
The 2-member mixing model assumes that streamflow at any time is the sum of Old Water and New Water at that same time:

where Q is flow rate in the stream at a time instant (t), and the subscripts s, n, and o refer to the total, new water, and old water components .
If a naturally occurring conservative chemical tracer can be distinctly identified in old and new water, the mass flow rate of that tracer in streamflow at any time is sum of the mass flow rate in old water and new water. Because mass flow rate can be expressed as the product of water flow rate and the concentration, C, of the tracer in water, conservation of mass for the tracer can be written as

If we solve equation 2 for Qn(t) and then substitute equation 1 into it, the expression for Qo(t) can be obtained as:

By integrating equation 3 over the duration of an event flow hydrograph we can obtain the total volume of old water contributions to event flow, which can be divided by the total volume of event flow leading to the proportion of an event flow hydrograph the resulted from old water contributions.
Key assumptions of this method:
- The tracer mixes conservatively. If 2 volumes are mixed, the concentration of the mixture is equal to the volume weighted average of the components.
- The concentrations of the components are sufficiently different to allow for comparison, within the measurement uncertainty of the instrument.
- The components are accurately sampled. The measured concentration is actually representative of the component.
Commonly used conservative tracers include chloride, silica, and oxygen isotopes. Such individual constituents are not routinely measured in streams. The electrical conductivity (EC) of water is measured more commonly. EC is a measure of the ability of water to carry an electrical current, and is an indicator of the total dissolved ion concentration. Although the assumptions of the 2-member mixing model are more commonly violated than if using individual conservative constituents (the conservative nature of EC is questionable), the convenient availability of high resolution EC data greatly enhances its usefulness. Results when using EC, however, should be interpreted with caution. In this exercise we will assume that EC is linearly related to any conservative solute that may be in the stream, and therefore use EC (mS/cm) in place of solute concentrations.
In the DCEW, rain storms producing significant measureable streamflow changes are not common. When they do occur, the chemical signatures of New Water are often complicated by mixtures of rain and snowmelt, and Old Water is complicated by large differences in the chemical signatures of soil moisture and deep groundwater. The two-component approach described here is best suited to humid regions where rain falls on moist soil overlying a shallow saturated zone that is hydraulically connected to a stream. Regardless, a few rainstorms in the DCEW can be used to illustrate the basic principles.
Project Instructions
Goal
The goal of this project is to investigate hydrograph contributions. Specifically, you will
- Inspect a specific storm event
- Separate a storm hydrograph into baseflow and eventflow
- Calculate old water and new water contributions
- Describe the purposes of each hydrograph separation approach as well as describe the impact that common end member mixing results have on hydrologic science and engineering

Project Files
Requirements & Connections
- Streamflow hourly time series
- Basic knowledge of plotting hydrologic variables in time series
- Skills learned from the Watershed Water Balance exercise (e.g., calculation of the effective depth of streamflow)
The instructions below outline specific steps to follow to complete the calculations. Ensure that you understand the problems and goals of this exercise by reviewing the information in the INTRODUCTION and BACKGROUND tabs.
1. View Annual Streamflow Hydrograph
- The LG-Discharge tab in the Project Workbook hourly streamflow data for the 2009 calendar year at the Lower Gauge (LG) site in Dry Creek. A scatter plot of discharge (y-axis) against time (x-axis) is automatically generated to represent the Lower Gauge Hydrograph for that year. Missing data values coded as -6999 may alter the y axis. If so, you can improve the chart by setting the minimum value of the y-axis to 0 or you can change the missing data code to NAN or some other non-numeric value
Note: The hydrograph is dominated by the large snowmelt event that peaks on April 21, 2009. Although several rain events occur throughout the year, Summer and early-Fall events are typically too small to produce significant discharge, Spring rains fall on the rapidly receding snowmelt runoff, and late-Fall/winter precipitation is complicated by snow. 2009, however, offered two large, relatively simple rain events causing streamflow peaks on June 15, 2009 and August 7, 2009. This exercise focuses on the August storm. The exercise can be repeated for the June storm.
- The Storm-August 7 tab contains data from 08/5/2009 0:00 and 8/11/2009 0:00. Compute the ‘Elapsed Time (hours)’ in Column B. The first entry should be zero, subsequent entries should be hours since zero. To compute elapsed time, you can subtract the previous DateTime from the current DateTime. This will have units of days. You must then convert days to hours. If there is no missing data, Elapsed Time should accumulate in hourly increments.
- Create a scatter plot with Elapsed Time (x-axis) vs. Discharge-L/s on (y-axis).
- Label the axes appropriately.
- Add a chart title: “LG August Storm Hydrograph”.
2. Separate Event Flow from Baseflow
Event flow can be separated from baseflow by many different approaches. If the hydrograph recedes to its prestorm value, a linear threshold can be implemented simply by drawing a straight line across the hydrograph connecting the pre and post storm baseflow values. You should see that this is not possible for this storm. A common technique is to select a point on the falling limb where flow appears to stabilize, or enter a very gradual recession, and then “draw” a sloping line from the pre-storm baseflow to this point. Flow above the resulting line is event flow. We will employ this technique here.
- In the ‘Baseflow’ column, calculate the slope of a line connecting the pre-storm baseflow to the post-storm baseflow in units of L/s per hour as follows:
- Find the point on the falling limb where the recession is “complete”. This is not obvious. For class consistency let’s assume that the falling limb enters baseflow at 117 hours.
- Record the corresponding Discharge value of the elapsed time of 117 in the ‘blue’ table Min Streamflow Post-Storm.
- Record the minimum streamflow from ‘Discharge (L/s)’ before the streamflow begins to rise (should be early morning of August 6). At this point, the stream discharge (Q) and the baseflow (Qbf)are the same. Populate the ‘blue’ table accordingly.
- Use these numbers to calculate the slope of the baseflow separation in the appropriate cell in the ‘blue’ table. You should obtain a slope of about 0.332 L/s per hour depending what you selected as the beginning of the storm.
- In the ‘Baseflow (L/s)’ column,
- At the time of minimum pre-storm discharge, set the Baseflow as equal to the corresponding Discharge L/s value for that time.
- Calculate the values of the baseflow for each time using the slope that you obtained in the previous step. Baseflow at any time (Qbft) is equal to the value of baseflow at the previous time (Qbft-1) plus the change in Qbf that occurred during the time step. The change in baseflow is defined by the slope you obtained in the previous step.

- Plot the ‘Baseflow (L/s)’ separation line against elapsed time on the hydrograph. Make sure that ‘Baseflow (L/s)’ and ‘Discharge (L/s)’ are on the same axis.
- Calculate ‘Event Flow (L/s)’ rates in the appropriate column by subtracting ‘Baseflow (L/s)’ from ‘Discharge (L/s)’.
- Plot ‘Event Flow (L/s)’ on the hydrograph.
- Calculate the ‘Event Flow Volume (L)’ by determining the area under the curve for the Event Flow hydrograph as follows:
- Calculate the incremental volume of event flow that occurred during that hour (multiplying the average of the event flow rates bounding that hour duration). Do this for each time step, and then sum the values to get the total volume. Enter the total volume in the appropriate cell in the ‘green’ table in the same workbook.
- Convert your Event Flow Volume to a depth (by dividing by the watershed area=27 km2). Report your answer in the appropriate cell in the ‘green’ table.
- Repeat to calculate volumes of baseflow and total flow for the duration of the event.
3. Calculate the Old Water and New Water Contributions to Event Flow
- Add a plot of ‘StreamEC-mS/cm’ vs. ‘Elapsed time’ to the hydrograph with electrical conductivity (EC) on the secondary y-axis. Label you axis accordingly.
- Determine the EC of NEW Water. Manual measurements from grab samples of the precipitation at Dry Creek indicate that rainfall has an electric conductivity of 0.013 ± 0.004 mS/cm. Enter 0.013 in the appropriate cell in the ‘orange’ table.
- Determine the EC of OLD Water. Ideally, the groundwater would be directly sampled, but this data is unavailable at Dry Creek. Presumably, the EC in the stream prior to the storm represents an integrated measure of the EC of OLD Water. Enter the determined value in the appropriate cell in the ‘orange’ table.
- You now have values for C1 and C2 for equation 3 [BACKGROUND]. Using the time series of stream concentration (Cst) and discharge (Qst), you can compute flow rates of OLD and NEW water. Do these calculations in the appropriate in ‘OLD Water (L/s)’ and ‘New Water (L/s)’ columns.
- Plot the the ‘OLD Water (L/s)’ and ‘NEW Water (L/s)’ series on the hydrographs made earlier. Make sure they plot on the primary y-axis.
- Calculate the volumes of OLD and NEW Water by determining the area under their respective hydrographs. Report your answers in the ‘green’ table.
4. Discussion Questions
- Calculate the proportions of Total Flow Volume due to Event Flow, Baseflow, Old Water, and New Water. Compare the ratio of New Water over Total Flow to that of Event Flow over Total Flow. Discuss the implication that these results have for hydrologic models that assume that infiltration excess overland flow is the dominant runoff generation mechanism.
- What meteorlogic or landscape properties might promote higher proportions of New Water in streamflow?
- The EC data are uncertain. What happens when you increase the EC of the precipitation? What happens when you increase the EC of the groundwater?
- Within the storm, when are new water relative contributions highest?
5. Deliverables
Unless instructed otherwise by your instructor, turn in the following:
- A copy of the completed/populated tables and plot of hydrographs from “Storm-August 7”
- Completed Discussion Questions.