Station Status: Operational, Active Telemetry
Note: Telemetry may fail during fire season/other.
Recent raw data is telemetered hourly.
Corrected data is available for download in the “Historical Data” tab.
General site description is available in the “Site Info” tab.
For questions or assistance with this data, please contact Dr. Chris Walser.
Lower Gauge Data

SITE INFO
DCEW Site: Lower Gauge
Location (Lat/Long): 43.68834, -116.17862
Elevation: 1036 m
Reporting Since: 1999
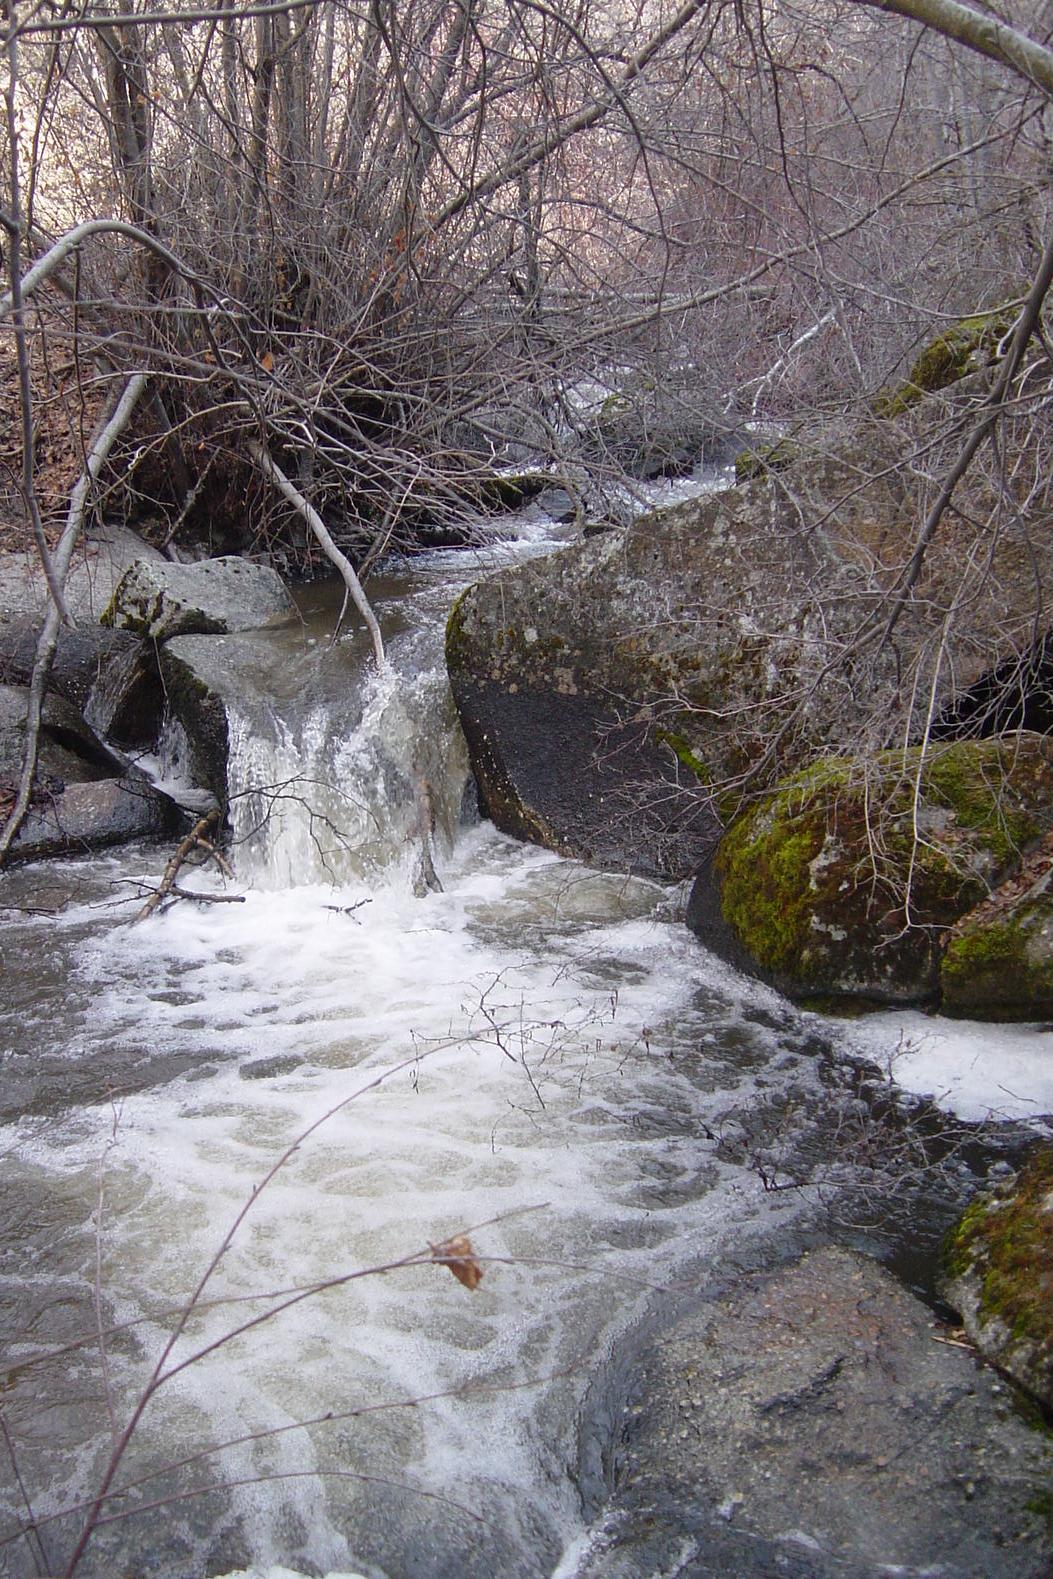
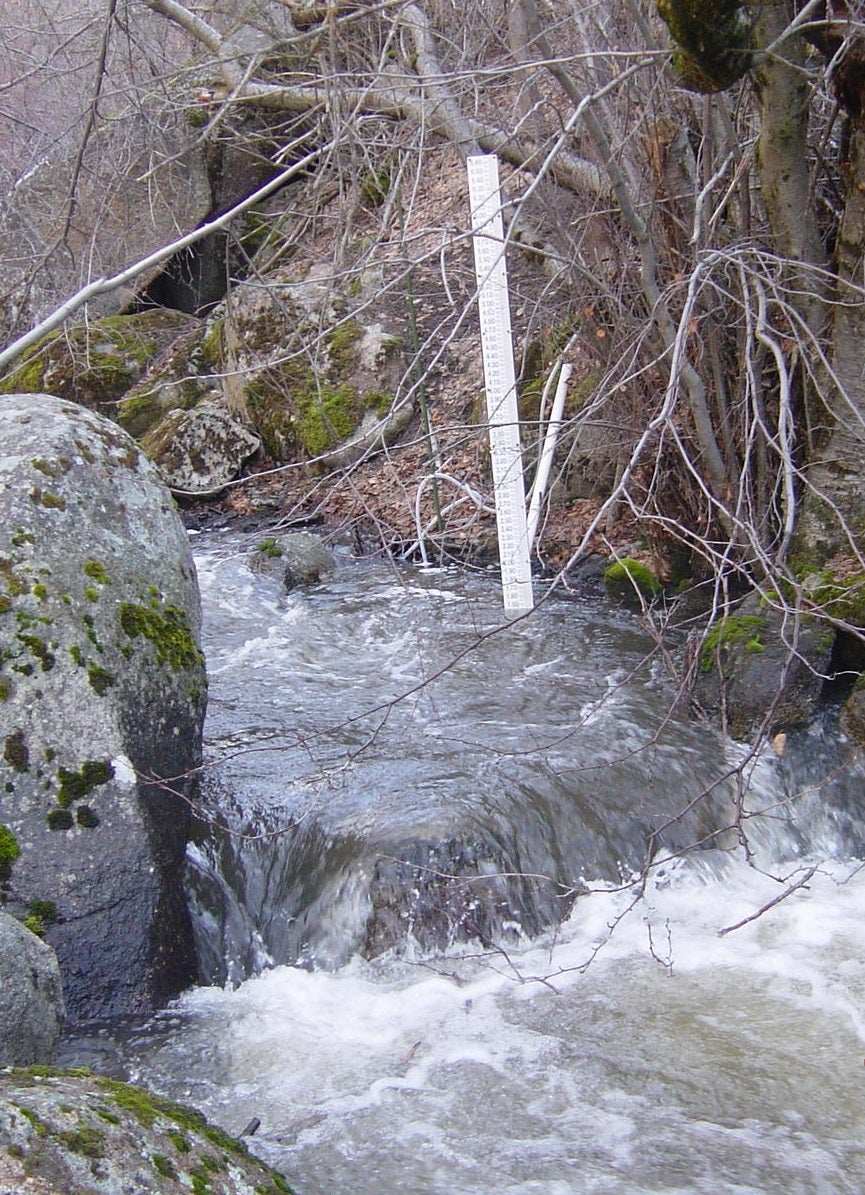
Site Notes: Lower Gauge (LG) site provides an outlet stream flow measurement for Dry Creek Experimental Watershed (DCEW). Instrumentation at this site has provided continuous in-stream water level stage data, as well as stream temperature, and conductivity. On site measurement of stream discharge is compared to site staff gauge height to provide a current rating curve validated or updated numerous times each year across the full discharge range. This rating curve is used to output continuous discharge data. Water samples have been collected at this site for analysis at weekly to monthly intervals since 2004, initially for major ions and more recently to include cations and oxygen isotopes.
Across DCEW, bedrock is predominantly fractured granodiorite with minor pegmatite occurrences. Minor fluvial, lacustrine and volcanic deposits occur adjacent to and down gradient from LG , as well as at rare ridge top locations above LG. Channel lithology is predominantly granitic boulder, cobble and sand with minimal to moderate floodplain presence, although on-bank vegetation is abundant. Terrain across DCEW is steep with thin sandy soils. Riparian vegetation is thick including willow and cottonwood, while low elevation hill slope vegetation is sparse brush and grass cover grading to thick shrub stands and Douglas fir and Ponderosa pine forest in the upper elevations, particularly on north-facing aspects. Stream flow from Dry Creek and Shingle Creek headwaters is south-southwest, spanning over 2000 m relief and 27 km² distance. For the ten year period 1999-2009, rare low flow/zero discharge occurred, late August, while annual peak discharge varied from 0.41-4.51 m³/s (generally occurring early April following snowmelt).


