In previous articles, we talked about carbon footprints in the United States and then narrowed it down to carbon emissions in the state of Idaho. In this article, we will focus on the GHG challenges that the City of Trees Boise is facing.
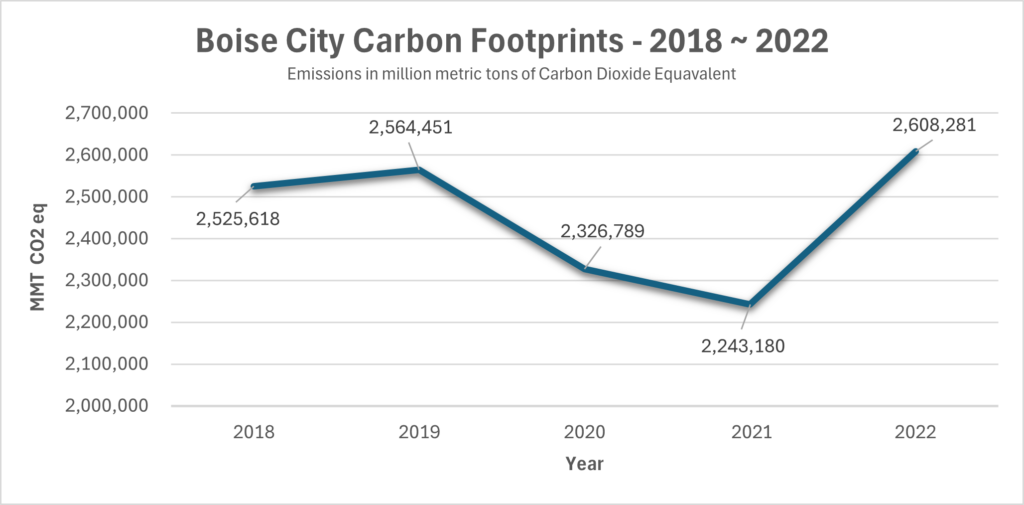
The following graph indicates that Boise’s GHG emissions in 2022 increased by 16.2% compared to 2021, reaching an estimated 2,608,281 million metric tons of CO2e. This increase is likely due to the return to normal activities in 2022 following the COVID-19 shutdown. However, despite this explanation, the 2022 emissions remain significantly higher than in 2018, and 2019.
Key Contributors to Carbon Emissions:
The City of Boise calculates the carbon emissions at two different levels.
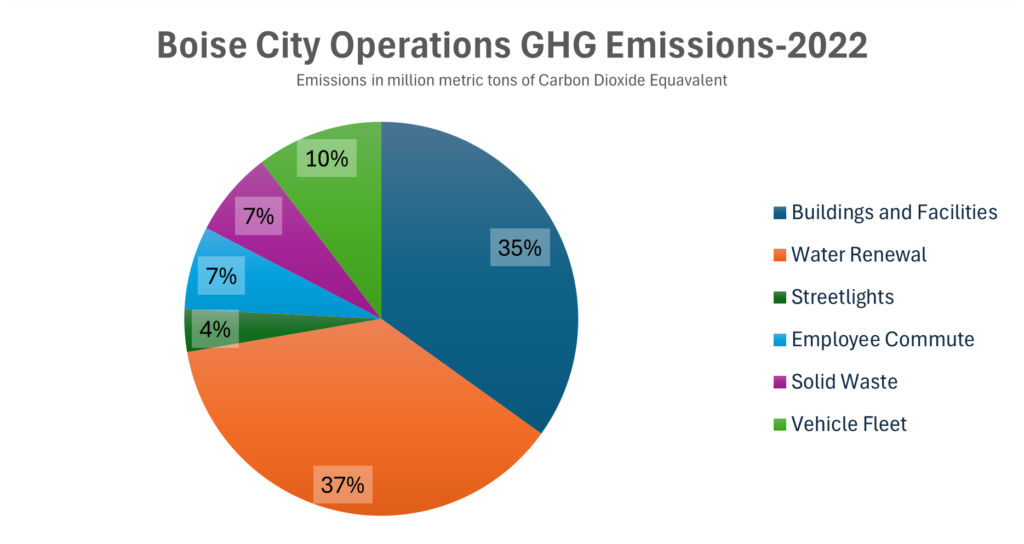
1) GHG in Government Operations:
The pie chart below illustrates the primary sources of greenhouse gas emissions in city operations. Water renewal accounts for 37%, followed closely by government buildings and facilities at 35%, while vehicle fleet and employee commute contribute 17%.
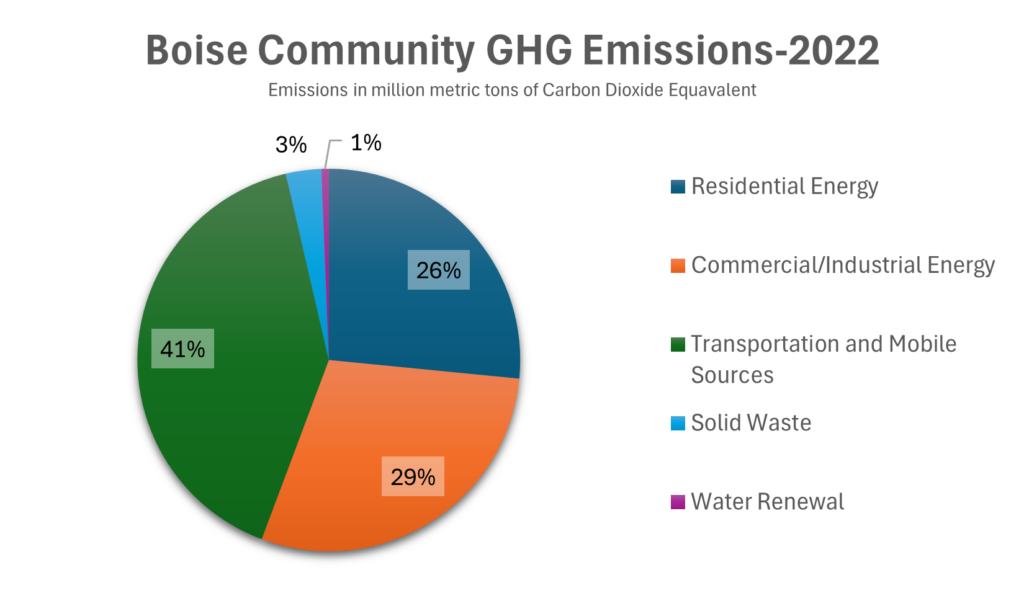
Community Greenhouse Gases:
The community GHG emissions inventory measures emissions from various sources, including transportation contributing 41%, energy consumption in residential, commercial, and industrial sectors at 55%, and solid waste at 3%.
Reducing Boise’s Carbon Footprint:
To address Boise’s carbon emissions, a multifaceted approach is needed. Here are some potential strategies:
Transportation:
Public Transit:
Investing more to expand the public transportation options can reduce the number of vehicles on the road, and so the carbon emissions.
Active Transportation:
Boise already has vibrant biking culture. However, promoting walking, biking, and other active transportation modes can decrease the dependency on cars.
Electric Vehicles:
There are very few numbers of electric vehicles in Boise. Encouraging the adoption of electric vehicles through incentives and infrastructure development (charging stations) can reduce transportation related emissions.
Energy:
Renewable Energy:
Increasing the use of renewable energy sources, such as hydro power, solar and wind power, can reduce reliance on fossil fuels.
Energy Efficiency:
Implementing energy-efficient measures in homes, businesses, and public buildings can reduce energy consumption, and so the carbon emissions.
Smart Grid Technology:
Adopting smart grid, and smart homes technology can improve energy efficiency and grid reliability.
Waste Management:
Recycling and Composting:
Promoting recycling and composting programs can reduce the amount of waste sent to landfills.
Waste Reduction:
Encouraging waste reduction practices, such as reducing packaging and avoiding single-use items, can decrease the overall amount of waste generated.
By implementing these strategies, Boise can reduce its carbon footprint, improve air quality, and contribute to a more sustainable future.
In the coming articles, our guest contributor Professor Daniel Rush will talk about META Artificial Intelligence Data Centre and its sustainability goals in Kuna, Idaho. Have any questions or want to know more about GHG emissions in Boise? Let us know at COBEEthics@boisestate.edu!
This article utilized data from the following sources: