Figure: The Declining Death Penalty in Idaho

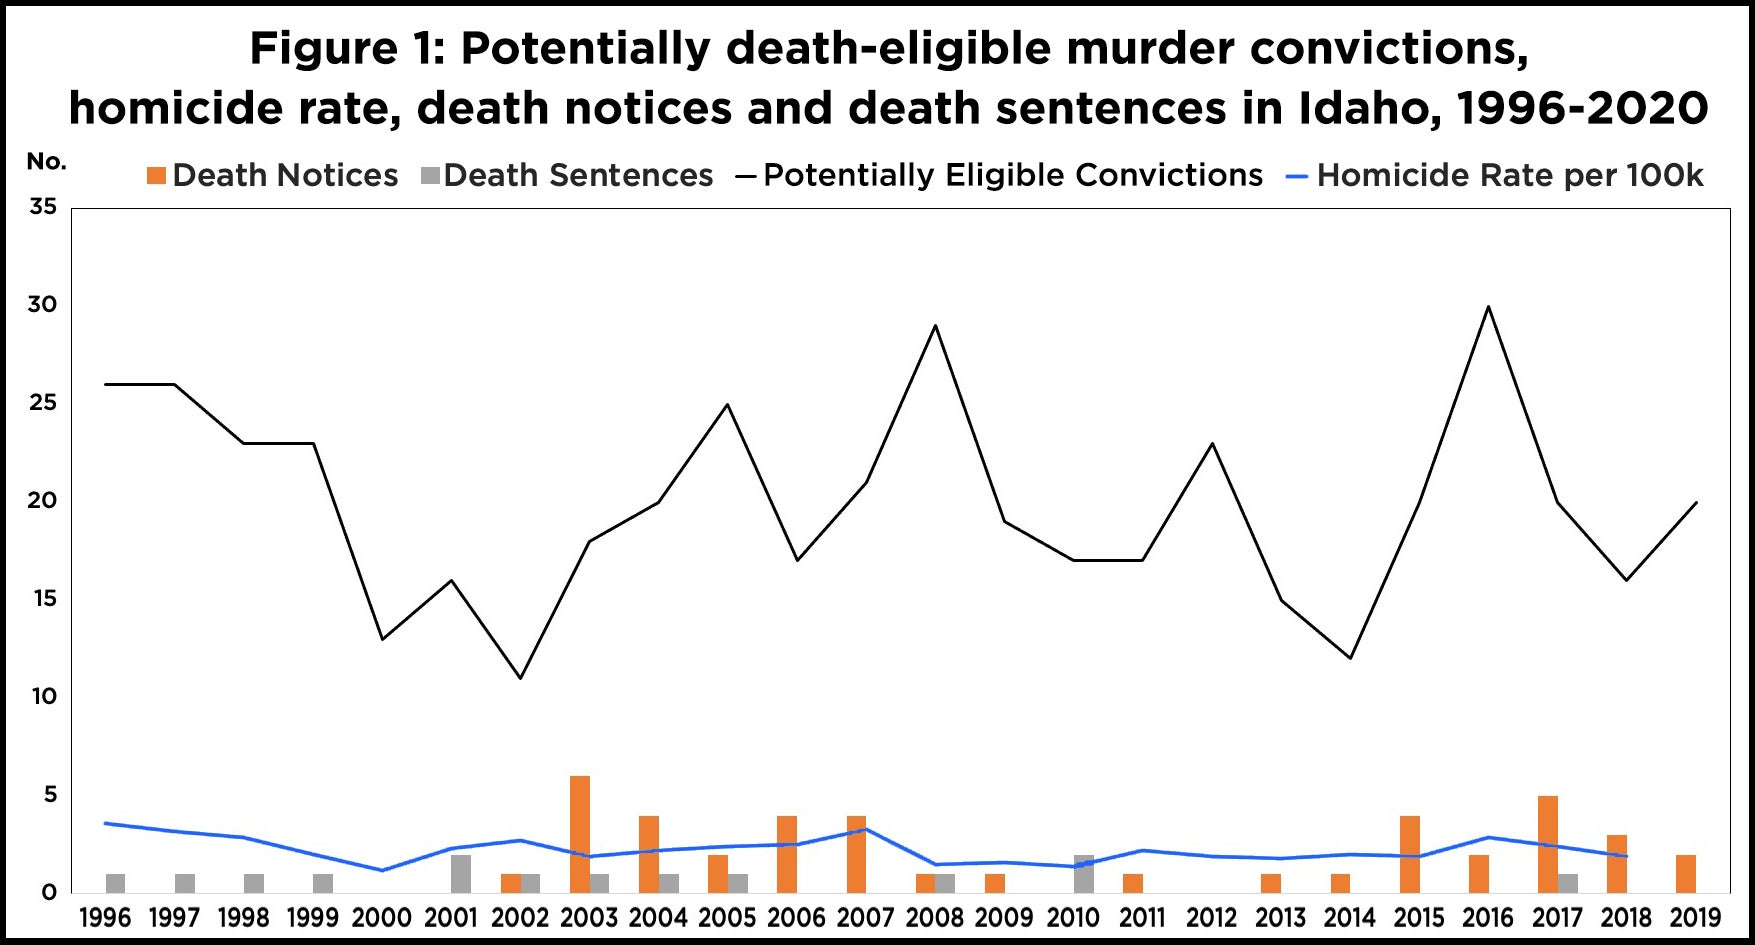
Figure 1: Potentially death-eligible murder convictions, homicide rate, death notices and death sentences in Idaho, 1996-2020
chart
Chart data can be reviewed in the table provided in the following section of this page.
YearPotentially Eligible ConvictionsDeath NoticesDeath SentencesHomicide Rate per 100k
19962613.6
19972613.2
19982312.9
19992312.0
20001301.2
20011622.3
200211112.7
200318611.9
200420412.2
200525212.4
200617402.5
200721403.3
200829111.5
200919101.6
201017021.4
201117102.2
201223001.9
201315101.8
201412102.0
201520401.9
201630202.9
201720512.4
201816301.9
20192020