Report Authors and Accessibility
Report Authors:
- Matthew May, Survey Research Director, School of Public Service
- Lantz McGinnis-Brown, Research Scholar, Idaho Policy Institute
- Vanessa Fry, Director, Idaho Policy Institute
- Anthony Bertelsen, Intern, Idaho Policy Institute
Accessibility Statement
Content on this site is monitored for compliance with WCAG 2.0 standards. We are continuously improving the usability of our content and are actively working to provide a more inclusive experience for all. Please, contact the Idaho Policy Institute immediately if you encounter any access barriers, challenges, or require the content in another format to fully access the information.
Report content is available on this page or as a downloadable PDF. An interactive dashboard is also provided. For a list of keyboard shortcuts specific to the Tableau dashboard, please visit Keyboard Accessibility for Tableau Views
To request the topline data and full tab book for any survey, email School of Public Service Survey Research Director Dr. Matthew May at: matthewmay1@boisestate.edu
Read the Tenth Annual Statewide Survey
About the Survey
The Tenth Annual Idaho Public Policy Survey was conducted November 9-14, 2024, and surveyed 1,000 adults who currently live in Idaho. The sample is representative of the state’s population, both geographically and demographically, with a margin of error of +/- 3.1%. The sample included respondents in 42 of Idaho’s 44 counties. Responses were weighted to ensure representativeness of Idaho’s demographics. The survey covered a wide variety of topics, including the economy, taxes, elections, education, housing, and healthcare. GS Strategy Group fielded the survey by cell phone (38%), landline phone (11%), online (40%), and text message (11%).
Key Findings
- Idahoans believe the state is headed in the right direction, showing an increase for the first time in six
years. - More Idahoans expect Idaho’s economy to get better for the first time since 2020.
- For the second consecutive year, workforce and affordable housing is Idahoans’ top overall legislative
budget priority. - Increased teacher pay is Idahoans’ top education budget priority.
- A majority of Idahoans say they oppose (53%) the use of tax dollars to pay for a private or religious
school. - Nearly half of Idahoans (49%) say access to health care is difficult in the state.
- 39% of Idahoans say increasing the number of immigrants helps Idaho’s economy, but that proportion
grows to 46% when discussing legal immigrants specifically. - A majority of Idahoans (55%) believe that abortion should be permitted in Idaho through at least the
first trimester. A majority (64%) also believe that exceptions for abortion access should be expanded. - A majority of Idahoans (51%) have concerns about the security of elections in the United States, but
less than a quarter (22%) have concerns about the security in Idaho itself. - A majority of Idahoans are concerned about campaign spending by independent groups in Idaho.
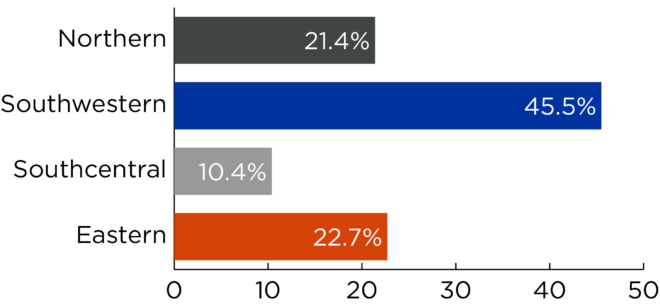
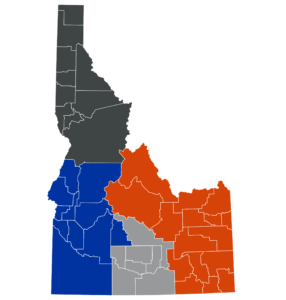
The Idaho Public Policy Survey polled 1,000 Idahoans representing 42 of Idaho’s 44 counties. 10th Annual Idaho Public Policy Survey
Overview
Each year for the past decade we have asked Idahoans whether they feel the state is headed in the right direction or if it is off on the wrong track. In recent years, the gap between the two answers has narrowed considerably, falling within the margin of error. Results this year reverse that trend, suggesting much greater optimism about the direction of the state – 49% say the state is headed in the right direction, a nine point increase over the prior year, while 37% say it is on the wrong track, a six point decrease. The 12 point gap between those who answered in the right direction and those who said wrong track is the largest since 2021 and is outside the margin of error for the first time in three years.
Do you think things in Idaho are generally headed in the right direction, or do you feel that things are off on the wrong track?
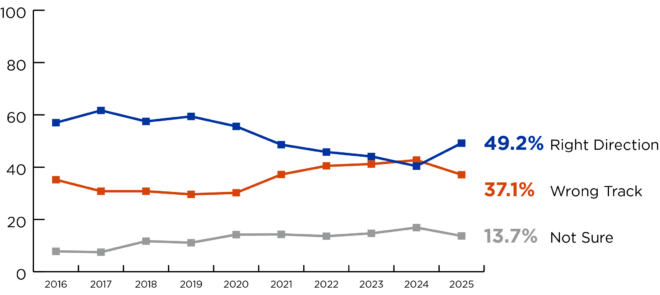
Political party remains a strong indicator of one’s outlook on the state’s direction. A strong majority of Republicans said the state was headed in the right direction (71%), favoring that response by a 51 point margin. Conversely, a strong majority of Democrats said the state is off on the wrong track (68%) and favored that response by a 46 point margin. Independents were more split between the two and falling within the margin of error, with 41% saying right direction and 43% wrong track. While there was little variation in responses according to the region of the state, those who have lived in Idaho more than 10 years were 11 points more likely to answer wrong track than newcomers to the state.
Why do you think things in Idaho are generally headed in the right direction? (n=492) [open-ended] Top 5 Responses
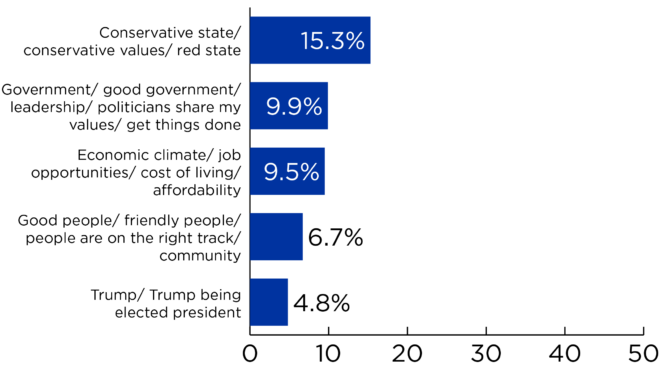
For the second consecutive year, we followed up with an open ended question asking Idahoans to explain why they answered the way they did. Respondents were free to answer however they wished and their responses were coded into like categories. Among those answering right direction, there was little agreement on the reason. Idaho being a conservative red state was the top response at 15%, followed by an overall positive assessment of the state’s government (10%). A similar proportion cited the economic climate (10%), followed by Idaho’s friendly community (7%). About 5% who answered right direction cited Donald Trump being elected as president as the reason. The remaining responses were each individually 4% or less of right direction respondents.
Why do you think things in Idaho are generally off on the wrong track? (n=371) [open-ended] Top 5 Responses
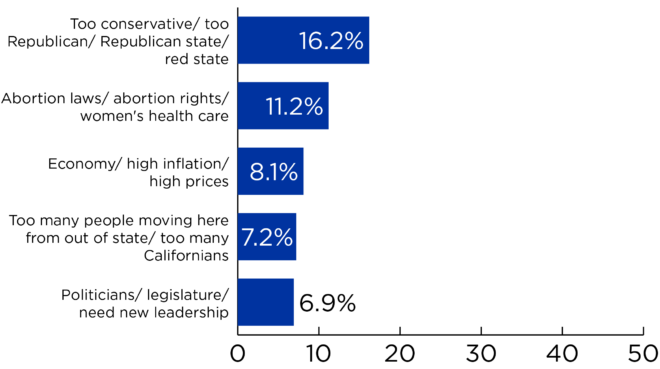
Among those who said the state was off on the wrong track, there was again little consensus. The state being too conservative or too Republican was again the top response (16%), followed by Idaho’s abortion laws and women’s health care (11%). The economy and high inflation (8%) was the third most frequent response, while too many people moving to Idaho from out of state (7%) was fourth, followed closely by politicians and the state legislature (7%). The remaining responses were each individually 6% or less of wrong track respondents.
Over the next two years, do you expect the economic condition in Idaho to get better, worse or stay about the same?
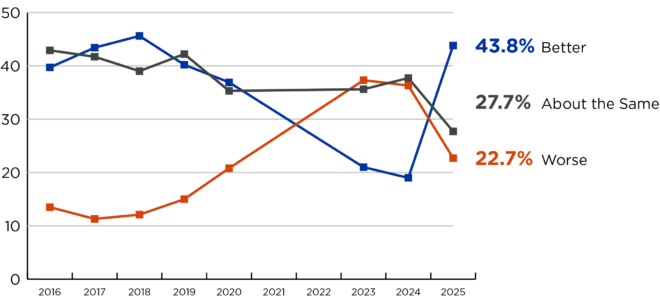
Idahoans’ optimism also extended to the economy. For eight of the last ten years, we have asked Idahoans if they expected the state’s economic condition to get better, worse, or stay about the same, with recent years trending towards a pessimistic outlook. Reversing this trend, more Idahoans now expect economic conditions to get better over the next two years (44%), a 25 point increase over last year. Less than a third of Idahoans expect things to stay the same (28%), a 10 point decrease from last year, while about a quarter (23%) expect things to get worse, a 14 point decline. The proportion answering better is the highest it has been since 2018, while those expecting things to stay the same has fallen below 30% for the first time in ten years. Eastern Idaho and Northern Idaho had the most optimistic view, with 49% of each region saying they expect economic conditions to get better. In contrast, only 44% of Southcentral Idaho and 39% of Southwestern Idaho felt similarly. Party identification was again a strong predictor of one’s economic assessment, with a majority of Republicans (64%) expecting things to get better, while smaller proportions expect things to stay the same (25%) or get worse (8%). Independents were generally positive, with 36% expecting things to get better, 29% worse, and 29% staying the same. Alternatively, Democrats generally have a pessimistic view, with worse (44%) being the top response followed by expecting things to stay the same (35%). Very few Democrats expected things to get better (13%). There was no substantial difference in responses based on the length of time one has lived in Idaho.
On a scale of 1-10, with 1 being not at all important and 10 being extremely important, how important would you say it is for the Idaho State Legislature to address each of the following issues? If you have no opinion, just say so.
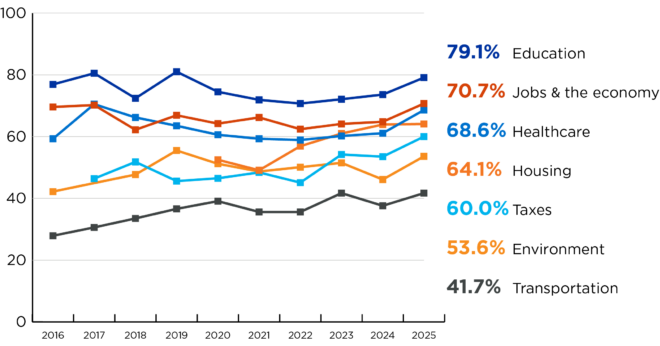
In each of the past 10 years, we have asked Idahoans to rate policy areas on a scale of 1-10 in terms of how important it is that the Idaho Legislature address that particular issue during the legislative session (1 being not at all important and 10 being extremely important). Topics include education, the environment, healthcare, housing, jobs and the economy, taxes, and transportation. Respondents were not asked about specific policy preferences in these questions, only which areas they felt warranted the Legislature’s attention. While all priorities saw increases in the proportion of Idahoans scoring them 8-10 compared to last year, the overall ordering remains relatively stable– the only change is healthcare reclaiming the third overall priority from housing, which had occupied it for the past two years and was the only priority area to see its increase stay within the margin of error.
Idahoans’ top scoring legislative priority remains education, with 79% scoring it 8-10, a six point increase from last year. It has consistently been Idahoans’ top legislative priority for the past 10 years. It was also the top priority for Democrats (86%), Independents (79%), and Republicans (79%) alike. Jobs and the economy (71%) was second highest scored priority, showing a six point increase over last year. While it was also the second highest priority for Republicans (78%), it was the third highest for Independents (67%) and the fifth highest for Democrats (63%).
As noted, healthcare was the third highest scoring legislative priority (69%), showing an eight point increase over last year. It was the second highest priority among Democrats (85%) and Independents (68%), but only the fourth highest among Republicans (64%). Housing (64%) fell to the fourth legislative priority, with only a slight increase that fell within the margin of error compared to last year. It was Democrats’ (84%) third priority, Independents’ (63%) fourth priority, and Republicans’ (59%) fifth. Taxes (60%) was the fifth overall legislative priority on Idahoans’ minds, showing a seven point increase from last year. Taxes were Republicans’ third ranked priority (73%), while they were Independents’ sixth ranked (53%) and Democrats’ lowest priority (49%). Coming in sixth overall was the environment (54%), which showed an eight point increase compared to last year. It was Democrats’ fourth ranked priority (79%), Independents’ fifth (58%), and tied for Republicans’ lowest priority (41%).
Finally, transportation (42%) was once again Idahoans’ lowest ranked legislative priority. While it saw a four point increase compared to last year, it has consistently been the lowest scoring priority over the past 10 years. Transportation was Democrats’ sixth ranked priority (52%), tied for Republicans’ lowest ranked (41%), and was Independents’ lowest ranked (40%).
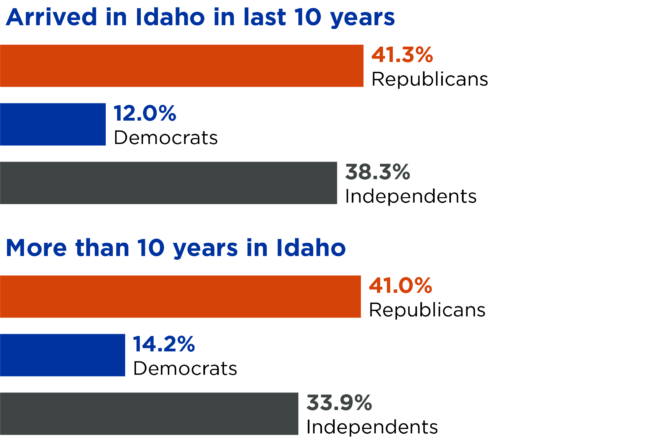
Potential differences between longtime Idaho residents and more recent arrivals has received increased interest. About 79% of survey respondents indicated they were longtime residents, having lived in Idaho for 10 years or more, and 21% reported moving to the state within the past decade. While a partisan split had emerged between new arrivals and longtime residents over the past two years, that split was not evident this year. About 41% of both longtime Idaho residents and new arrivals identify themselves as Republicans, a six point increase compared to last year among longtime residents and a five point decrease among newcomers. About a third of longtime residents (34%) identify themselves as independents, a five point decline over last year, compared to 38% of new arrivals, which constitutes a nine point increase. Similar proportions of longtime residents (14%) and new arrivals (12%) identify as Democrats. With party identification between the two groups once more matching the historical trend of being similar, it is unclear whether the previous two years are outliers.
Which level of government should be responsible for enforcing immigration laws in Idaho?
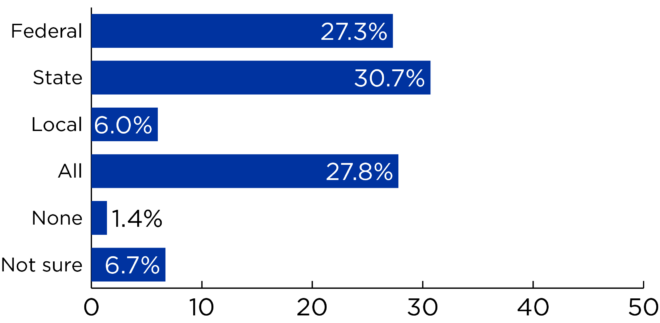
Finally, we asked Idahoans which level of government–federal, state, or local–they felt should be responsible for enforcing immigration laws in Idaho. Nearly a third (31%) said that enforcing immigration laws should be the state’s responsibility. Alternatively, 28% said that it should be the responsibility of all levels of government to enforce immigration laws, while a similar proportion (27%) said it should be the federal government’s responsibility. Only 6% said that local governments should be responsible, while 1% said it should not be any level’s responsibility. There was a slight partisan difference, with Republicans more likely to answer all levels, Democrats more likely to say the federal government, and Independents more likely to say the state.
Taxes and Budget
Idahoans tend to be very passionate about the state’s budget and taxes. We once again asked respondents what they thought should be the top budget priority for Idaho’s legislature when considering the state budget in 2025. For the second year in a row, workforce and affordable housing (32%) was the top response, although it decreased six points compared to last year. It was closely followed by funding K-12 education (28%), which enjoyed a five point increase from last year. Giving tax relief to Idahoans (23%) came in third, a similar proportion to last year, while 10% said transportation and infrastructure and 3% said it should be something other than the provided options.
Which of the following should be the top priority for Idaho’s legislature when considering the state budget in 2025?
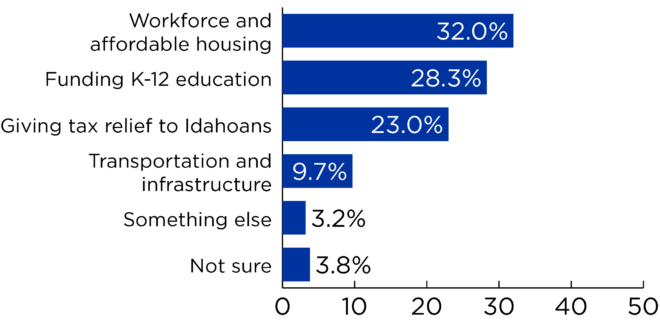
Workforce and affordable housing performed strongest in the Southwest Idaho region surrounding Boise (35%) and the weakest in Northern Idaho (26%). Republicans tended to favor tax relief (34%) as their top budget priority, followed by workforce and affordable housing (27%) and K-12 education (21%). Among Democrats, workforce and affordable housing (38%) was the top response, followed by K-12 education (36%) and tax relief (12%). Independents were split between K-12 education (34%) and workforce and affordable housing (33%), with tax relief (17%) a distant third. Longtime residents were nine points more likely than new arrivals to say K-12 education should be the top budget priority, while new arrivals were five points more likely to say tax relief. Renters were 27 points more likely to say workforce and affordable housing (49%) than homeowners (22%), while in turn homeowners were 11 points more likely to say tax relief (27%) than renters (16%).
Which of the following should be the top priority for Idaho’s transportation budget?
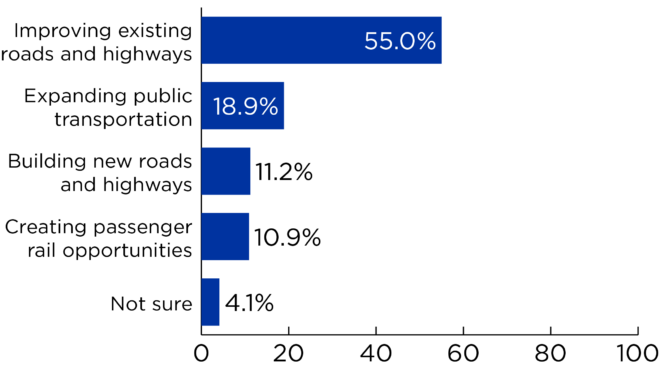
Improving roads and highways 55.0%, expanding public transportation 18.9%, building new roads and highways 11.2%, creating passenger rail opportunities 10.9%, not sure 4.1%When looking at the state’s transportation budget specifically–which recall was respondents’ lowest scoring legislative priority– a majority of Idahoans say improving existing roads and highways should be the top priority (55%). Following as a distant second is expanding public transportation (19%), while building new roads and highways (11%) and creating passenger rail opportunities (11%) rounded out the list. Regionally, support for improving existing roads and highways was more pronounced in Northern (67%) and Eastern Idaho (64%) than Southwest (46%) or Southcentral Idaho (42%). Similarly, while improving existing roads and highways was the top transportation budget priority regardless of party identification, support was far more pronounced among Republicans (66%) and Independents (51%). Democrats tended to be split between improving existing roads and highways (38%) and expanding public transportation (36%).
If you were to see a form of tax relief in the next year, which type of tax should be reduced to provide the most help to Idahoans during this time?
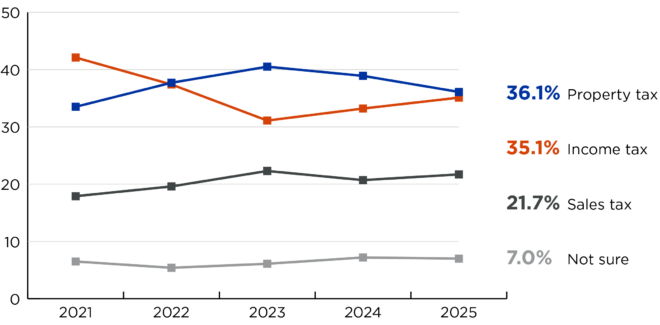
For the past five years, we have asked Idahoans, if they were to see a form of tax relief in the next year, which type of tax should be reduced to provide the most help to Idahoans during this time. While responses stayed within the margin of error compared to last year, respondents were split between property tax (36%) and income tax (35%), returning to a statistical tie between the two types last seen in 2022. Regionally, property tax relief was favored in Northern Idaho by a 10 point margin and in Eastern Idaho by a six point margin. Alternatively, the Southcentral Idaho region near Twin Falls favored income tax relief by a five point margin. Southwest Idaho including Boise mirrored statewide results with a split between both types. More Republicans favor property tax relief (41%) over income tax relief (34%). Conversely, income tax relief was the top response among both Independents (35%) and Democrats (34%), although property tax relief was a close second (33% among Independents and 32% among Democrats). Unsurprisingly, renters tended to favor income tax relief by a 24 point margin, while homeowners preferred property tax relief by a 13 point margin.
In general, would you say that property taxes in Idaho are too high, too low or about right?
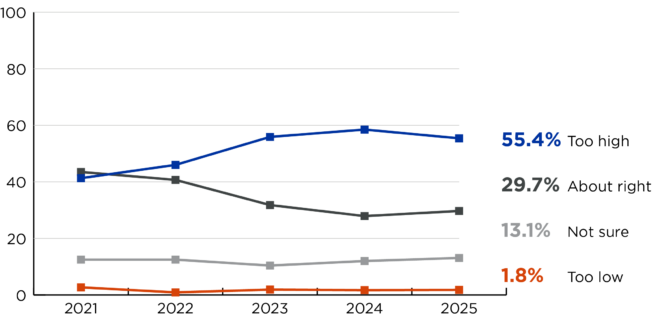
Despite the preference gap between property and income tax relief narrowing, Idahoans remain very concerned about property tax levels in Idaho. When asked whether property taxes in Idaho are too high, too low, or about right, a majority of respondents indicated they are too high (55%). Less than a third say they are about right (30%), while very few say they are too low (2%). The year-to-year change staying within the margin of error indicates that concern over property taxes may have plateaued, although this concern remains high. Longtime Idaho residents were eight points more likely to indicate property taxes are too high (57%) than new arrivals to the state (49%).
In Idaho there are thousands of properties owned by non-profits. Often those entities do not have to pay property taxes.
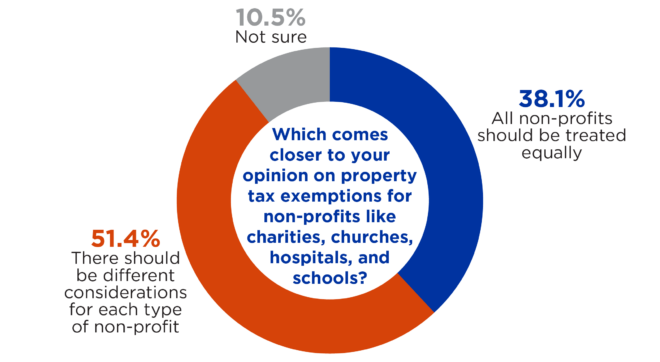
In Idaho, there are thousands of properties owned by non-profit organizations. Often, these entities do not have to pay property taxes. We asked Idahoans, when it came to these exemptions, whether they felt property tax exemptions for non-profits like charities, churches, hospitals, and schools should be treated equally or if they believed there should be different considerations for each type of non-profit. A majority of Idahoans said there should be different considerations for each type (51%), while 38% said all non-profits should be treated equally, with the remaining 11% not sure.
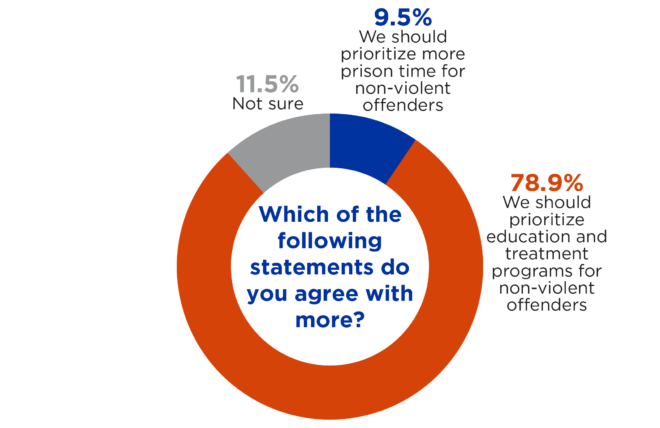
We also sought to understand Idahoans’ priorities when it comes to criminal justice, specifically whether they feel it is more important for the state to prioritize incarceration of individuals or their rehabilitation. An overwhelming majority of respondents said the state should prioritize education and treatment programs for non-violent offenders (79%), while few said it should prioritize more prison time for non-violent offenders (10%). These results are similar to those for questions asked in 2021 which also showed Idahoans favored treatment and rehabilitation over incarceration.
Economy and Housing
Over the past year, immigration and housing have been prominent topics in the media, reflecting their significant role in shaping the economic landscape. These factors directly impact workforce dynamics, consumer demand, and community development, making it crucial to understand their interplay amid the state’s rapid growth. To examine Idahoans’ perceptions of the economic impact of immigration in the state we asked a split sample question with half the sample being asked “What do you think the economic impact of increasing the number of immigrants in Idaho is?” and the remainder being asked “What do you think the economic impact of increasing the number of legal immigrants in Idaho is?”
What do you think the economic impact of increasing the number of immigrants in Idaho is? (n=496)
What do you think the economic impact of increasing the number of legal immigrants in Idaho is? (n=504)
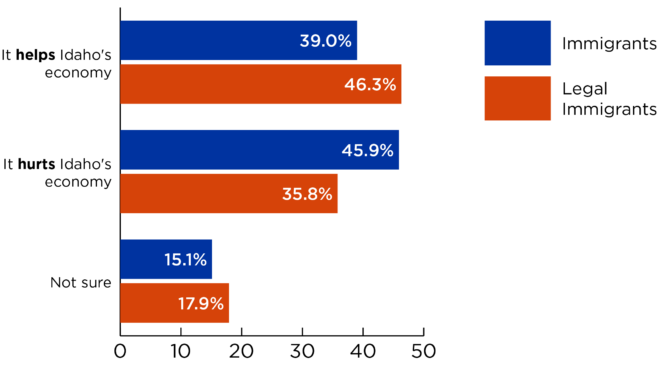
When presented only with the descriptor of “immigrants,” 39% of Idahoans say increasing their number helps Idaho’s economy while 46% believe increasing their number hurts Idaho’s economy. Alternatively, when given the descriptor “legal immigrants,” the numbers reverse– 46% now say they help Idaho’s economy, while 36% say they hurt it, a seven point shift. The survey reveals significant differences in perceptions of immigration’s economic impact based on party affiliation, demographics, and question wording. Democrats are far more likely than Republicans to view immigration positively, with Independents falling in between. For example, 76% of Democrats believe legal immigration helps Idaho’s economy, compared to 32% of Republicans, a 44 point margin that widens to 64 points when instead asking about immigration in general. Republicans showed a notable 14-point increase in positive responses when the term “legal” was specified. Non-white respondents were slightly more positive than white respondents across both versions of the question, with the gap widening when discussing immigration in general. Education level and lifelong residency in Idaho also influenced perceptions; lifelong Idahoans and those with higher education levels were more likely to view legal immigration favorably. Regionally, respondents in Southcentral Idaho expressed higher positivity toward legal immigration (55%), though this difference diminished for general immigration. Across both versions of the question, respondents not employed were less likely to view immigration positively. Next, to test the economic vulnerability of Idahoans, we asked how respondents would deal with a major unexpected expense, such as $1,000 for an emergency room visit or car repair. Half said they would pay the cost from their savings (50%), by far the most frequent response. Smaller proportions said they would finance with a credit card (14%), forgo other expenses in their budgets (10%), borrow from family or friends (8%), or take out a personal loan (5%).
Which of the following best describes how you would deal with a major unexpected expense, such as $1,000 for an emergency room visit or car repair?
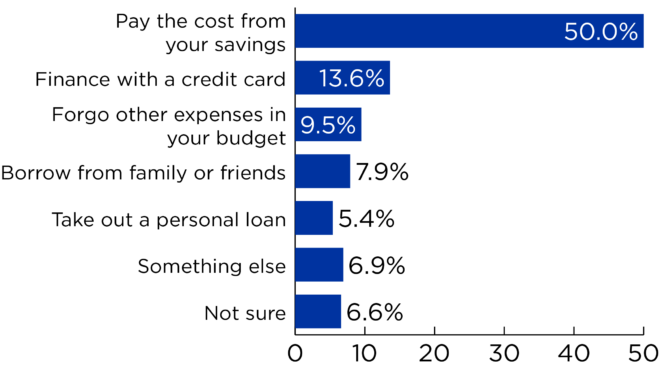
Economic vulnerability among Idahoans varies based on housing status, income, education, race, and economic outlook. Homeowners are more likely to cover a $1,000 unexpected expense from savings (59%) compared to renters (36%)—a 23-point gap. Higher income and education levels correlate with greater financial resilience, as 69% of those without housing-related financial strain said they could rely on savings, compared to just 36% and 25% of those reporting moderate or significant housing constraints, respectively. Similarly, economic outlook plays a role: 57% of those optimistic about Idaho’s economy responded they could use savings, compared to only 40% of those with a pessimistic outlook. Racial disparities were also evident, with 50% of white respondents able to use savings compared to 42% of non-white respondents, an 8-point gap. These findings underscore the role of socioeconomic factors in shaping financial security across the state. As indicated previously, housing remains a critical issue for Idahoans, with homeownership and rental patterns reflecting broader economic and demographic divides.
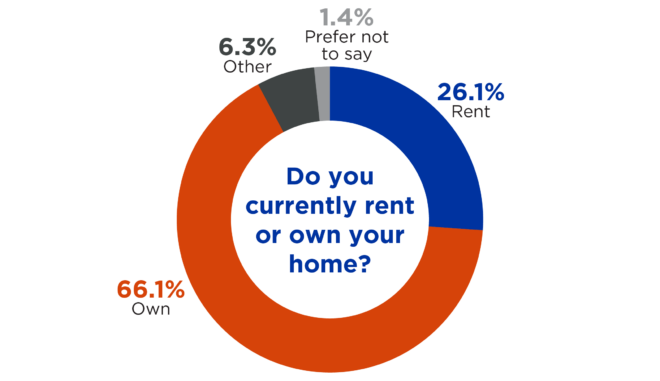
Similar to last year, two-thirds of respondents (66%) own their homes, while about a quarter (26%) rent, and 6% fall into other housing categories. Renters are more likely to have lower incomes, with 49% of those earning under $50,000 annually renting, compared to just 9% of those earning over $100,000. Age also plays a role, with those aged 45 years or under more likely to report renting (37%) than those over age 45 (18%). Additionally, renters express significantly less optimism about Idaho’s economic future, with only 23% expecting improvement compared to 72% of homeowners—a striking 49-point gap. These disparities underscore the financial and generational challenges facing renters in the state. This is further played out when considering how housing impacts a household’s economic security.
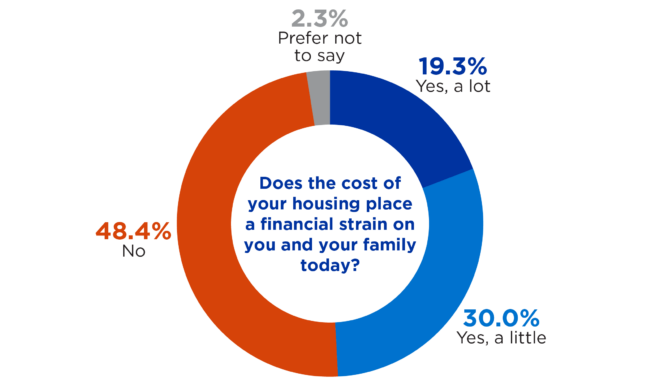
Nearly half of Idahoans (49%) report experiencing financial strain from housing costs, with 19% stating the strain is substantial and 30% saying the strain is only a little. This marks a slight three point decline from last year, within the margin of error. Renters (71%) are far more likely to feel this strain than homeowners (39%), a 32-point gap. Financial strain also varies by demographic factors: 58% of non-white respondents report strain compared to 48% of white respondents, and those earning under $50,000 (65%) report experiencing strain more than those earning over $100,000 (36%). Idahoans aged under 45 years are also more likely to feel pressure from housing costs (59%) compared to those aged 45 and older (42%). Regional disparities exist as well, with Canyon County residents most likely to report strain (56%), compared to only 43% in Southcentral Idaho. Finally, preferences for tax relief appear to correlate with housing strain, as those favoring income tax relief (55%) and sales tax relief (50%) report higher levels of strain compared to those favoring property tax relief (42%), reflecting the economic realities faced by renters.
Health Care
Health care access and abortion access are complex and sensitive topics that significantly impact individuals and families across Idaho. Both issues continue to be widely discussed, reflecting diverse public opinions and their far-reaching implications for individuals, families, and communities.
How would you describe access to health care for most Idahoans?
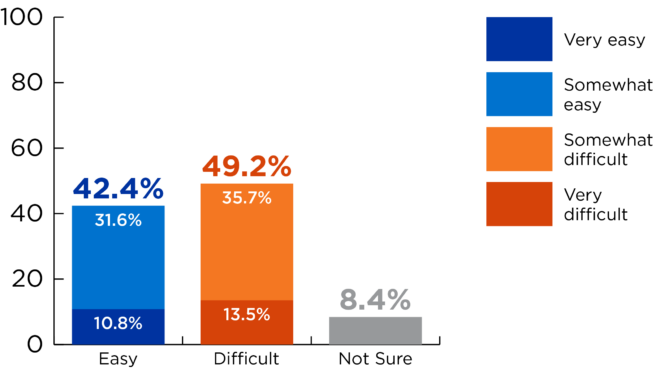
Nearly half of Idahoans (49%) describe access to healthcare in the state as difficult, with 36% saying it is somewhat difficult and 14% saying it is very difficult. Comparatively, 42% say access to health care is easy– 32% somewhat easy and 11% very easy. The remaining 8% are unsure. Perceptions of difficulty vary significantly by political affiliation, with more Democrats (70%) saying healthcare access is difficult, compared to Independents (55%) and Republicans (37%)—a 33-point partisan gap. Those who believe Idaho is on the “wrong track” are much more likely to view healthcare access as difficult (71%) compared to those who think the state is headed in the “right direction” (33%), a 38-point divide. Women (56%) are more likely than men (42%) to report difficulty and those with incomes under $50,000 are 13-points more likely to perceive access as difficult than those earning over $100,000. Additionally, respondents favoring fewer restrictions on abortion access were more likely to report healthcare difficulties. As noted earlier, healthcare ranked as the third most important issue facing the Idaho Legislature, underscoring its critical importance to residents. The shifting legal landscape following the overturning of Roe v. Wade has brought the issue of abortion access into sharper focus, prompting Idahoans to express their views on the appropriate time frame for permitting abortions within the state.
After Roe vs. Wade was overturned by the Supreme Court, abortion access is now determined on a state-by-state basis. Knowing this, which of the following comes closest to your opinion on the time period in which abortions should be permitted in Idaho?
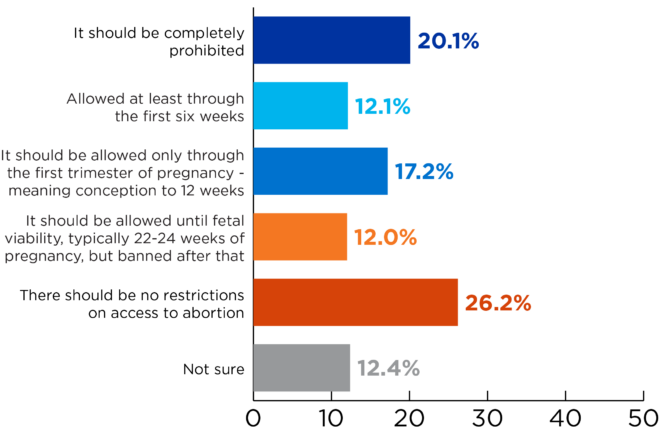
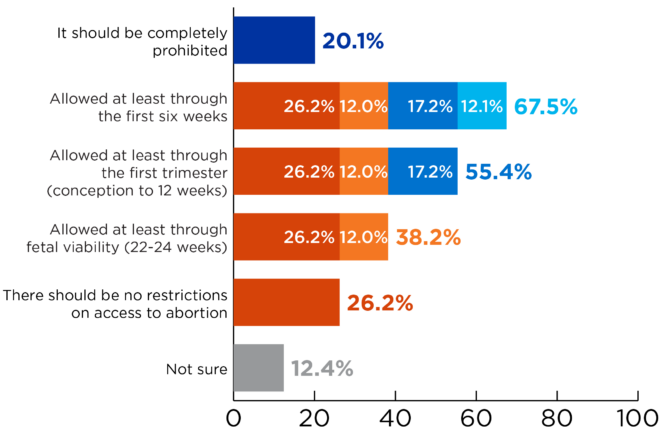
Survey results demonstrate a wide range of opinions on abortion access in Idaho, reflecting the complexity of this issue. While 20% believe abortion should be completely prohibited, 26% support no restrictions on access. Other respondents favor restrictions at various stages, including only in the first six weeks of pregnancy (12%), through the first trimester (17%), and until fetal viability at 22-24 weeks (12%). Combining each permissive response with the options that were even more permissive–for example, a respondent who believes there should be no restrictions on access to abortion would likely agree that it should also be allowed in the first six weeks, the first trimester, or through fetal viability– we see that a majority of Idahoans (55%) favor allowing abortion at least through the first trimester, while 38% believe it should be allowed through fetal viability.
A significant partisan divide emerges, with 34% of Republicans favoring a complete ban compared to just 1% of Democrats, while 58% of Democrats support no restrictions compared to 11% of Republicans—a 47-point gap. Gender differences are within the margin of error, though women are slightly more likely to favor no restrictions (29%) than men (23%). Few notable differences are observed across age, education, race, or income, highlighting that views on abortion access in Idaho are primarily shaped by political affiliation.
Building on the discussion of abortion access and its time frame, Idahoans were also asked to weigh in on their preferences regarding specific exceptions to abortion policies in the state.
And, generally speaking, which of the following policies regarding exceptions to abortion access would you prefer for Idaho?
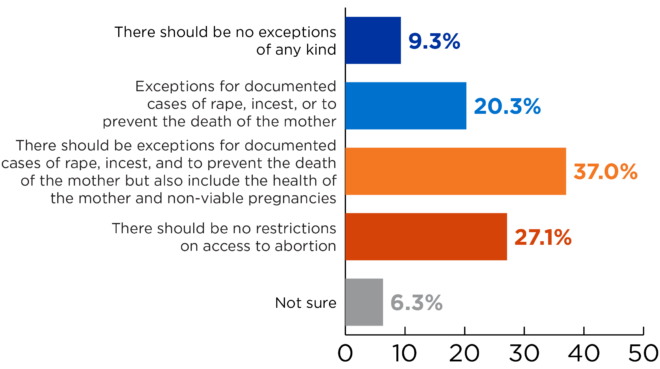
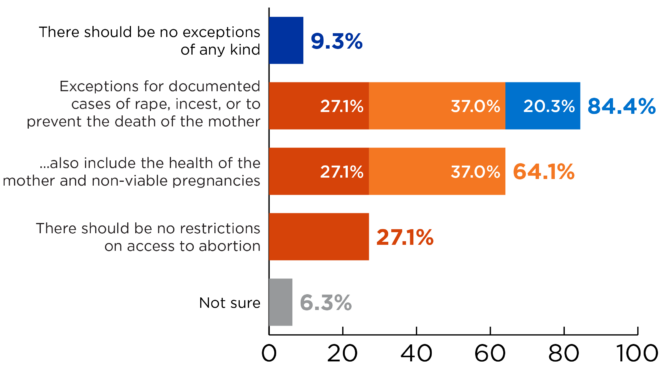
The survey highlights diverse perspectives on abortion policy exceptions in Idaho, with the most common response (37%) favoring exceptions for rape, incest, the life and health of the mother, and non-viable pregnancies. The remaining Idahoans are split between believing there should be no restrictions on access to abortion (27%), limiting exceptions to documented cases of rape, incest, or preventing the death of the mother (20%), and a total ban with no exceptions (9%). Again, combining each permissive response with the options that were even more permissive, we see that a majority of Idahoans (64%) believe that there should be at least exceptions for documented cases of rape, incest, the life and health of the mother, and non-viable pregnancies.
The partisan divide persists: among Republicans, the top response (41%) was allowing exceptions for rape, incest, the life and health of the mother, and non-viable pregnancies, while a third (32%) favored fewer exceptions. For Democrats, the most common answer was no restrictions (57%), which was also the second most popular response for Independents (36%). Gender differences were more pronounced, with women (34%) more likely than men (25%) to favor no restrictions, though the top response for both genders was allowing exceptions for rape, incest, the life and health of the mother, and non-viable pregnancies (39% of men and 35% of women). Notably, 11% of those who believe Idaho is on the “wrong track” attributed this sentiment to concerns about abortion laws, highlighting the salience of this issue in public opinion.
Education
Education is consistently Idahoans’ top legislative priority each year, resulting in a variety of opinions regarding education policy. Each year, we ask respondents to rate the quality of education in Idaho’s K-12 public schools, both statewide and in their own district, using a scale of excellent, good, fair, or poor.
How would you rate the quality of education in Idaho’s K-12 public schools?
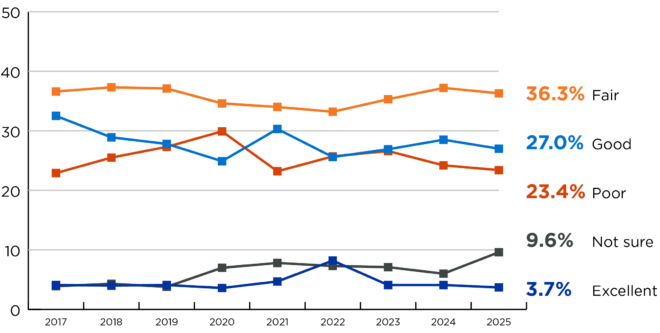
Statewide, very few rated the quality of Idaho’s K-12 education as excellent (4%). Instead, Idahoans were more likely to rate it either good (27%) or fair (36%), while nearly a quarter said that it was poor (23%). These numbers have not seen any major shifts in recent years and this year was no exception–all categories fell within the margins of error compared to last year, suggesting that the wave of optimism seen in other questions about the state’s direction has not generally impacted Idahoans’ opinions about educational quality in the state. However, those with a child or grandchild in an Idaho K-12 school tended to be more positive and almost twice as likely to rate Idaho’s schools as excellent or good (40%) compared to those without (24%).
And thinking specifically about your school district, how would you rate the quality of K-12 public schools in your area?
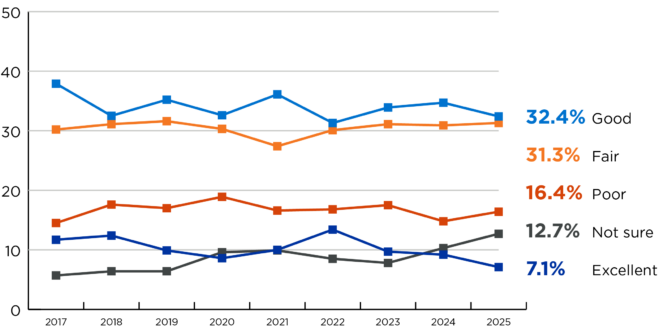
When it comes to their own school districts, respondents once again tended to be more optimistic. Slightly more respondents rated the quality of education in their school districts as excellent (7%), although again most rated them good (32%) or fair (31%). Few describe their quality as poor (16%) – a seven point decrease compared to the state as a whole. Again, parents and grandparents were more likely to rate their schools as excellent or good (49%) than non-parents (34%). Additionally, those with incomes above $100,000 a year were more likely to say excellent or good (51%) compared to those with incomes below $50,000 a year (35%).
Which of the following should be top priority for the K-12 public schools’ budget?
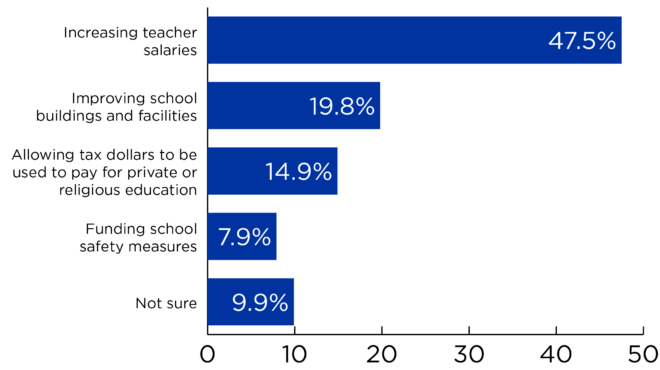
Given the importance Idahoans place on education, this year we asked what they considered the top priority for Idaho’s K-12 public schools’ budget. Increasing teacher salaries (48%) was the clear top priority, with improving school buildings and facilities (20%) a distant second. Allowing tax dollars to be used to pay for private or religious education (15%) was the next highest response, followed by funding school safety measures (8%). Increasing teacher salaries was the top response among Idahoans from all political parties, although Republicans (33%) showed less agreement overall compared to Democrats (71%) and Independents (56%). Improving school buildings and facilities was the second choice for both Democrats (19%) and Independents (18%), while among Republicans it was allowing tax dollars to be used to pay for private or religious educations (25%).
We next asked Idahoans if they would support or oppose the use of tax dollars to help pay for a private or religious education if a parent chooses not to send their child to a local public school. This policy is sometimes referred to as “school choice,” although that term can also be applied broadly to other related policies; for this reason, our question’s focus was measuring attitudes on the specific action of the policy, rather than testing the language of “school choice.”
Do you support or oppose the use of tax dollars to help pay for a private or religious education if a parent chooses not to send their child to a local public school?
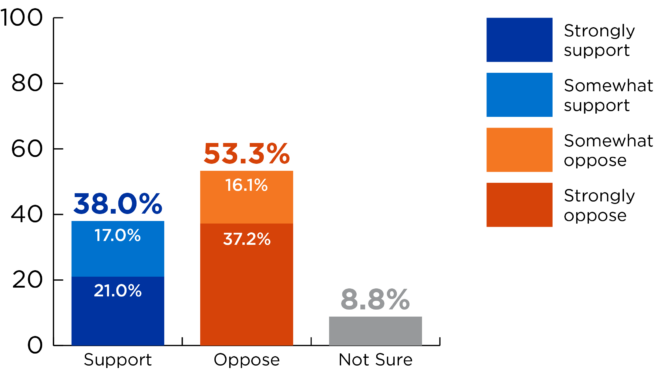
Idahoans were split on this policy – 38% supported it (21% strongly), while 53% were opposed (37% strongly). Responses were divided along partisan lines, with support for the policy strongest among Republicans (52%), followed by Independents (36%) and Democrats (12%). Parents and grandparents of children in Idaho’s K-12 public schools were generally more supportive (44%) than non-parents (35%), a nine point difference. Support was especially high among respondents whose top legislative budget priority was tax relief (60%), and low among those whose top legislative budget priority was funding K-12 public schools (26%). As a follow-up, we asked Idahoans, regardless of their position on allowing tax dollars to be used to pay for
private or religious education, whether they would support or oppose making this program available only to households making less than $75,000 per year (the median household income in Idaho in 2023)1 as a form of means-testing. Responses to this question were divided, with 45% of respondents supportive (17% strongly), and 41% opposed (25% strongly). A limitation of these results is that we cannot conclusively say whether opposition is attributable to a dislike of the concept of means-testing itself or instead the $75,000 median household income figure included as the potential threshold in the question wording.
Regardless of your position on allowing tax dollars to be used to pay for private or religious education, if it were adopted would you support or oppose making this program available only to households making less than $75,000 per year?
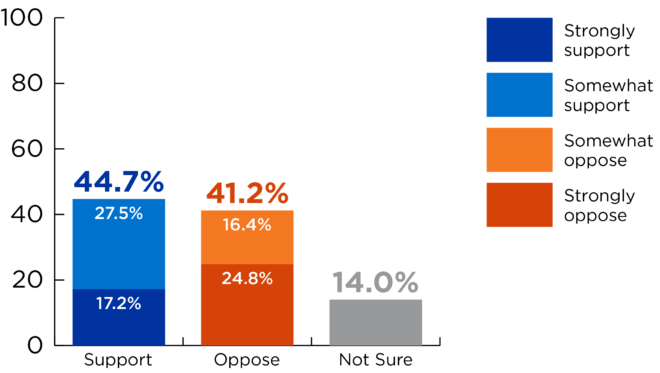
Party did not have a strong impact on responses to this question; 40% of Republicans, 49% of Democrats, and 51% of Independents indicated support. Higher income respondents with yearly incomes over $50,000 were less likely to support means-testing (42% support) compared to those making less than $50,000 a year (53% support). Parents and grandparents of children in Idaho’s K-12 public schools were also five-points less likely to support means-testing. Those who support allowing tax dollars to be spent on private or religious educations were more likely to also support means-testing for this program (51%) than those opposed to the policy (41%), although opponents may have been inclined to oppose means-testing as a way of expressing their opposition to the program in general.
Would you support or oppose a ban on cell phones in K-12 public school classrooms in Idaho?
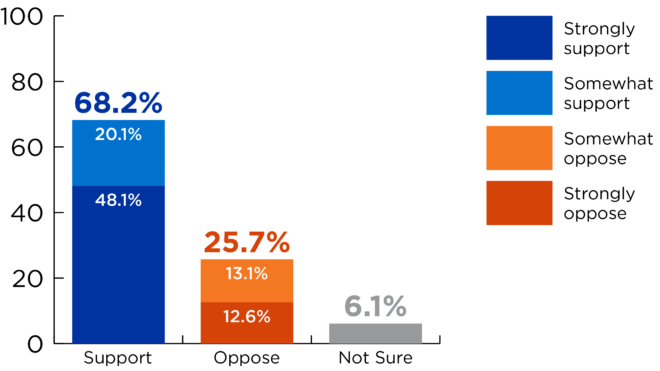
Finally, we asked Idahoans if they would support or oppose a ban on cell phones in K-12 public school classrooms in Idaho. A majority of Idahoans (68%) said they would support such a ban (48% strongly), while only a quarter (26%) would oppose it (13% strongly). Support was strong across all political parties, regardless of perception of educational quality in Idaho, and regardless of whether a respondent had a child or grandchild in Idaho K-12 public schools. Additionally, support was strongest among those aged 45 or older (75%), but remained strong among those under the age of 45 (59%).
Elections
With the numerous races dominating much of the last year, elections were front and center in Idaho. From voting behavior to election security, campaign spending, and the initiative process, this year’s survey included several election-related questions.
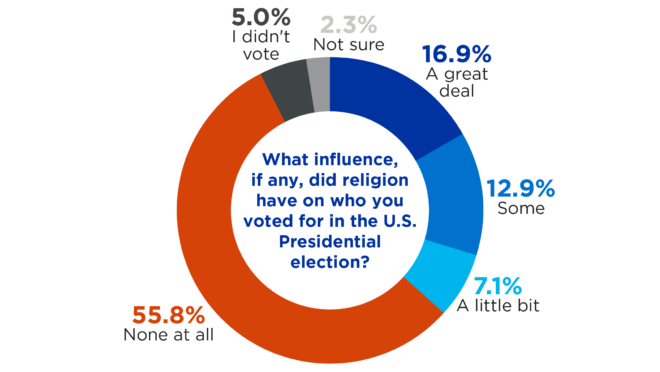
We asked Idahoans what influence, if any, religion had on who they voted for in the U.S. Presidential election. While 37% said religion played a role – 7% a little bit, 13% some, and 17% a great deal – a majority reported religion played no role at all (56%), while 5% said they did not vote. Republicans were more likely to say religion played at least some role (53%). Majorities of both Democrats (77%) and Independents (63%) said religion played no role in their vote.
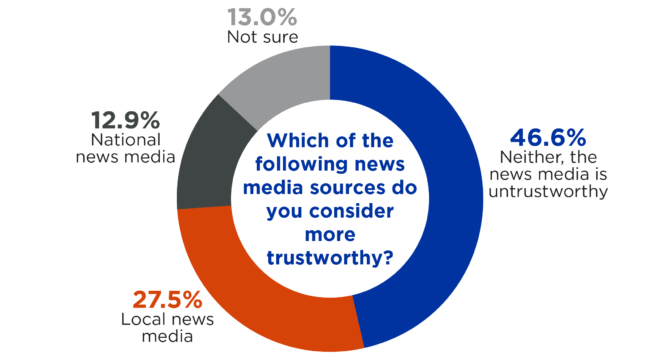
As individuals gravitate towards preferred news media outlets more and more, we asked Idahoans which news media source they considered more trustworthy – local news media or national news media? About 27% said they trusted their local news more, while 13% trusted national news media. But, nearly half said neither, as they considered both sources untrustworthy (46%). Party identification played at least some role in their response, as neither was the top response for both Republicans (58%) and Independents (47%), followed by local news media (28% and 29%, respectively). Conversely, Democrats were split between national (33%) and local (33%) news media, with neither being their third most frequent response (24%). New arrivals to Idaho were 10 points more likely to say they trusted neither than longtime residents, while longtime residents were nine points more likely to answer local news media.
Do you have any concerns about the security of elections in the United States – yes or no? (n=1,000)
Do you have any concerns about the security of Idaho elections – yes or no? (n=1,000)
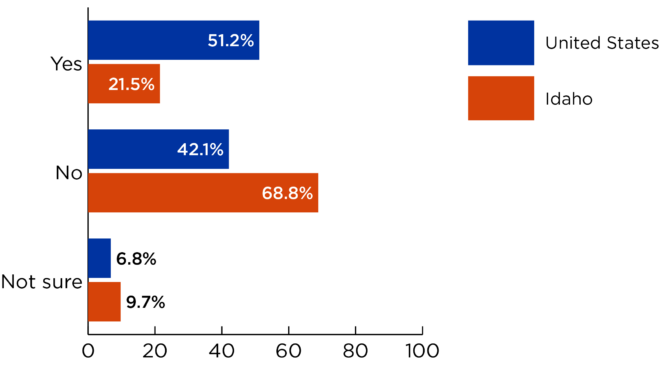
Election security has increasingly become a part of election discourse in recent years. While we have asked Idahoans’ perception on the security of Idaho’s elections in the past, this year we wanted to see how it fared against their perception of the security of elections in the U.S. as a whole. When it comes to the U.S., a majority of Idahoans (51%) say they have concerns about the security of elections, while 42% do not–a nine point margin in favor of concerns. Republicans are far more likely to say they have concerns about U.S. election security (68%) than Independents (43%) or Democrats (30%).
Do you have any concerns about the security of Idaho elections – yes or no?
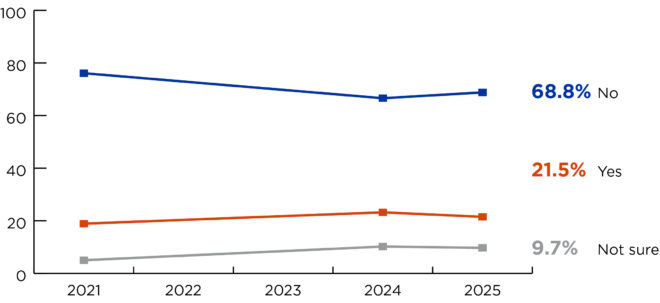
In Idaho, concerns are far less pronounced. Only 22% say they have concerns about the security of Idaho’s elections while 69% say they have no concerns – a 47 point margin in favor of not having any concerns. There is far less variability according to one’s party, with few Republicans (24%), Independents (20%), and Democrats (17%) expressing concerns. With three years of data on perception of the security of Idaho’s elections, we can see that concern has been relatively flat since 2021. Spending in Idaho’s elections has increased considerably in recent years. In the 2024 May primary election, nearly $3.7 million was spent by independent groups not affiliated with a specific campaign or candidate, with over $1 million of that coming from outside of Idaho. To better assess Idahoans levels of concern with this spending, we deployed a split sample approach where we asked half of our sample one version of the question and the other half a slightly different version. In this case, while both versions of the question shared the $3.7 million amount, only one included the language about $1 million coming from out-of-state groups. We then asked Idahoans to rate their level of concern about spending by independent groups.
In the May 2024 primary election, nearly $3.7 million dollars was spent by independent groups not affiliated with a specific campaign or candidate[, with over $1 million dollars of that coming from outside of Idaho]. To what degree are you concerned about the amount spent by independent groups in Idaho, very, somewhat, not very or not at all? (n=504, n=496)
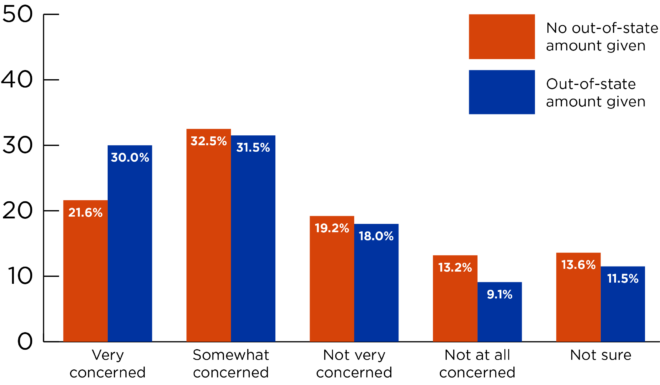
When the out-of-state amount is not given, a majority (54%) said they were concerned about independent group spending, while nearly a third were not concerned (32%). Regionally, Southcentral Idaho was not concerned by a four point margin, while other regions were all concerned by various margins – a 15 point margin in Northern Idaho, a 17 point margin in Eastern Idaho, and a 32 point margin in Southwest Idaho. In terms of party identification, Independents were most concerned (60%), followed by Democrats (57%) and then Republicans (50%).
When the out-of-state dollar amount is included in the question wording, Idahoans’ concern increased by seven points – 62% of Idahoans expressing concern, with most of the increase occurring in the very concerned category, while 27% are not concerned. Interestingly, all four regions show concern by substantial margins– Southcentral Idaho by a 27 point margin, Southwest Idaho by a 35 point margin, North Idaho by a 35 point margin, and Eastern Idaho by a 37 point margin. Similarly, Republicans now show the most concern (67%), followed by Democrats (62%) and Independents (60%).
Would you favor or oppose requiring out-of-state groups participating in Idaho’s elections to disclose their donors?
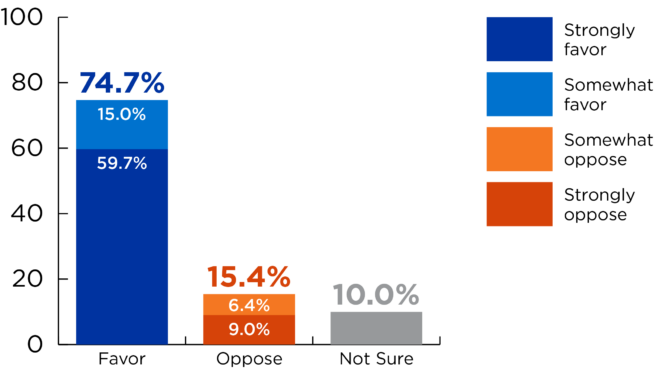
We followed up that question by asking all respondents whether they would favor or oppose requiring out-of-state groups participating in Idaho’s elections to disclose their donors. An overwhelming majority said they favored (75%) such a move, while only 15% opposed. Interestingly, there was no major party effect on their response. While this question was asked of all respondents, since it dealt with out-of-state spending and half of the sample had been provided with additional information related to just that, we wanted to see the split sample’s effect on this question, as well. The effect was relatively minor– 73% in favor without the out-of-state dollar amount, 77% in favor with the added context, an increase of four points.
As you know, Idaho citizens have the right to propose ballot initiatives to enact state law without the involvement of the Idaho Legislature. When a ballot initiative is passed by voters, what do you think the Legislature should be allowed to do with that law?
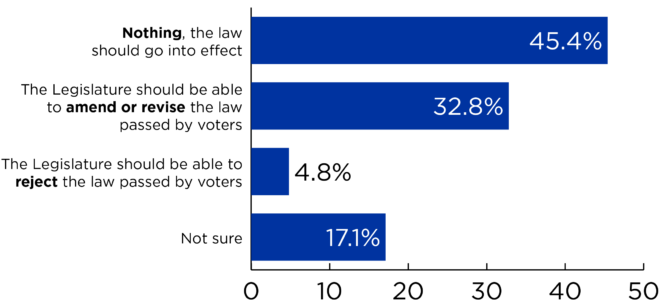
As in a handful of other states, Idaho citizens have the right to propose ballot initiatives to enact state law without the involvement of the Idaho Legislature. That said, since Idaho’s initiative process can only amend state code, not the state constitution, any such measure can still be changed–or rejected– by a subsequent act of the Idaho Legislature. With increasing attention paid towards these ballot initiatives in recent years, we asked Idahoans, when a ballot initiative is passed by voters, what they think the Legislature should be allowed to do with that law. The most frequent answer given by Idahoans was nothing, the law should go into effect (45%). Roughly a third said that the Legislature should be able to amend or revise the law passed by voters (33%), while only 5% said the Legislature should be able to reject the law. That said, a large proportion (17%) were not sure, indicating an unfamiliarity with the issue. Republicans were split between the Legislature being able to amend the law (38%) and nothing, the law should go into effect (37%). Nothing, the law should go into effect was the top response of both Democrats
(61%) and Independents (52%), while similar proportions of both said the Legislature should be able to amend the law (29% and 30%, respectively).
Land Management
Land management is a continual debate here in Idaho. With a majority of the land in the state being owned by the federal government (63%),2 there is much discussion regarding how this land should be used and maintained.
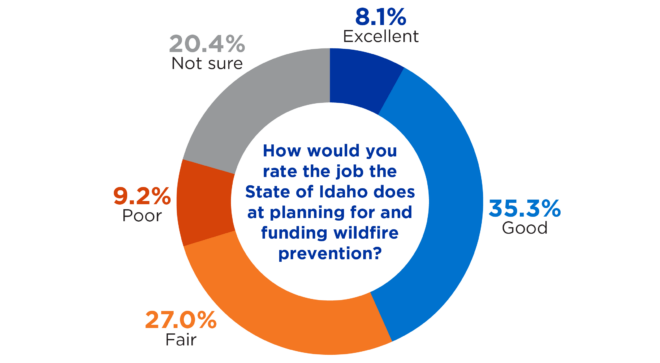
We asked Idahoans to rate the job the State of Idaho does at planning for and funding wildfire prevention using a scale of excellent, good, fair, or poor. While few would rate the state’s job as excellent (8%), many were split between rating it good (35%) or fair (27%), while the proportion rating it poor (9%) was similarly low. A fifth of respondents (20%) said they were not sure, suggesting many Idahoans did not feel confident enough to offer a rating one way or the other. Regionally, most areas shared relatively similar views, but some looked more favorably on the state’s efforts than others. Northern Idaho had the most positive view, with half (50%) viewing the state’s work favorably. Southcentral Idaho was the second-most favorable, with just under half (48%) having a positive outlook, followed by Southwest Idaho (41%) and Eastern Idaho (40%). Favorability was also high among those who thought the state was headed in the right direction (59%), 30-points higher than those who felt the state was off on the wrong track (29%).
Overall, which of the following best describes your current attitude about largescale solar energy projects in Idaho?
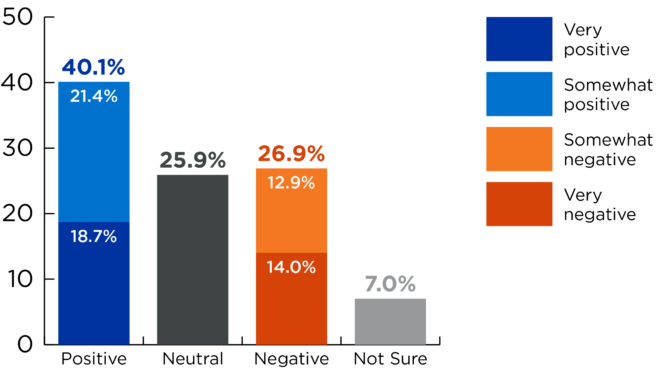
Discussions surrounding the placement of large-scale solar and large-scale wind energy projects in Idaho are ongoing. We asked Idahoans whether they had a positive, neutral, or negative opinion of each. While Idahoans generally have a more positive view of each type of project than negative, there remains much uncertainty. When asked specifically about large-scale solar projects, more Idahoans indicated a positive attitude (40%) than a negative one (27%), although a little more than a quarter (26%) characterized their attitude as neutral. Republicans generally expressed a more negative attitude towards large scale solar projects (41%) than Democrats (5%) or Independents (21%). Similarly, Democrats were much more likely to hold a positive view (71%) than Independents (46%) or Republicans (26%). Regional differences are also seen with approval of solar projects, where Northern Idaho has the highest approval (44%), followed by Eastern Idaho (42%), Southwest Idaho (39%), and Southcentral Idaho (32%).
And which of the following best describes your current attitude about large-scale wind energy projects in Idaho?
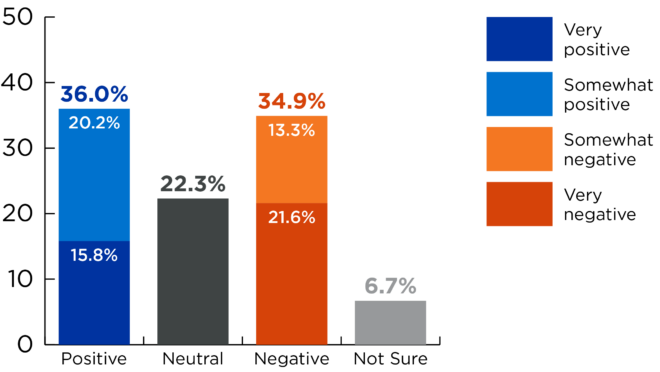
Alternatively, when asked specifically about large-scale wind energy projects, Idahoans are more split. While slightly more say they have a positive attitude (36%) towards these projects than a negative one (35%), the difference falls within the margin of error. Additionally, a fifth of Idahoans characterize their attitude towards large-scale wind projects as neutral (22%). Once again, a major partisan difference is observed, with Republicans far more likely to express a negative attitude (51%) than Independents (30%) or Democrats (7%). At the same time, Democrats are far more likely to hold a positive attitude (65%) than Independents (42%) or Republicans (22%). Regionally, Northern Idaho again had the highest positive attitude (40%), followed by Southwest Idaho (38%), Eastern Idaho (33%), and Southcentral Idaho (27%).
Conclusion
Over the past ten years, the Annual Idaho Public Policy Survey – like its predecessor for 20 years before it – has explored the attitudes of Idahoans on the major policy issues facing the state. This year is no different. The survey research team is unwaveringly committed to ensuring the questions asked each year are valid and reliable measures of the underlying policies being studied and, most importantly, objectively capture where Idahoans are on a given issue today. This past decade, the Annual Idaho Public Policy Survey has tracked how Idahoans view the direction of the state and their legislative priorities on a yearly basis, allowing us to confidently identify concerning trends when they arise and, just as importantly, when those trends reverse– as several have this year. These data points serve as valuable indicators to policymakers as they consider competing legislative solutions for Idaho. Above all, it is an annual opportunity for Idahoans as a group to give voice to their policy preferences on the issues of the day, whether it be health care, education policy proposals, tax relief, election reform, abortion policy, or another range of issues. Understanding Idahoans’ attitudes enables Idaho’s policymakers to take these perspectives into account when crafting solutions for the state.
Resources
The School of Public Service at Boise State University is home to a wide variety of faculty experts on many topics relevant to the 2025 Idaho Public Policy Survey. View the full list of experts.
The Idaho Policy Institute works across the state with public, private and nonprofit entities. To support IPI’s work or inquire about how we can conduct a survey for your organization, please reach out to Survey Research Director Matthew May: matthewmay1@boisestate.edu.
Retrospective on the Public Policy Survey
This year we are marking the 10th anniversary of the current version of Boise State University’s Statewide Public Policy Survey. Longtime Idahoans, however, may remember that we’ve been hearing about the results of this annual survey for much longer than 10 years. The first version of the survey was conducted in 1990 under the direction of Dr. Greg Raymond and the Social Science Research Center (SSRC), a unit in the College of Social Sciences and Public Affairs. Back then, Boise State had fewer than 15,000 students and the stadium held only 23,000 people. Much has changed at Boise State University and the state of Idaho since 1990. We now have over 27,000 students at Boise State and the stadium holds 36,000 people. One thing about Boise State, however, has stayed the same: we remain committed to producing an objective survey of public opinion in Idaho that will be useful to policy makers and citizens as they debate the issues of the day.
The survey was administered annually by the SSRC and later by the Public Policy Center throughout the 1990s and the early 2000’s. Many faculty members and staff worked on the survey including Gary Moncrief, Les Alm, Jim Weatherby, and myself. The Great Recession took a toll on budgets and the survey was discontinued for a period of years. A reorganization in 2014 led to the creation of the School of Public Service, where the administration of the annual survey resides now. The survey is now directed under the capable hands of Matthew May.
The survey and the release of its findings have always been timed to correspond with the opening of the Idaho Legislature’s sessions. It is a sign of the importance of the survey that results are released to the Governor and legislative leadership just before presentations to the media and the public. The Public Policy Survey is quoted widely in media stories, results are repeated in legislative committee hearings and used in policy analyses. Generations of students have used the survey to learn and analyze public policy. The survey remains the go-to source for objective evaluations of policy issues in Idaho. I’m proud of this longstanding Boise State tradition of public service.
Stephanie Witt, Ph.D.
12 December 2024
30 Years of Surveying Idaho
Since 1990, the Idaho Policy Institute has surveyed Idahoans about their opinions on relevant topics in our state. To view previous survey dashboards, visit our website.